Why does this matter?
Climate negotiations are not decided purely by the biggest emitters. History shows that smaller groups of determined countries — nations that might represent under 1% of global emissions — can anchor the outcomes that really matter.
The Alliance of Small Island States (AOSIS) was instrumental in securing the 1.5°C temperature target in the Paris Agreement. The High Ambition Coalition, a cross-regional group of around 100 parties, pushed through ambitious transparency language that larger blocs had resisted. In both cases, the key was alignment, geographic diversity, and timing — not size or emissions.
Standard tools in international economics and game theory are designed to predict which agreements are stable — but they are not well-suited to answering a different question: which small combinations of countries carry the most leverage to shift the entire system?
This research builds a formal mathematical framework to answer exactly that question, grounded in real treaty-participation data from 175 non-G20 nations.
The approach
Why ordinary tools fall short
Most game-theory models treat influence as a two-way relationship: country A influences country B. But diplomacy is often triadic — the way two countries jointly behave shapes how a third country updates its position. A bilateral model simply cannot capture this.
What is a "tipping coalition"?
We define a tipping coalition as a small group of countries whose coordinated commitment to cooperation pushes the system past a critical threshold — causing a qualitative shift in how other countries behave. Think of it as a domino effect: the right combination in the right position tips the whole board.
The mathematical criterion for tipping is based on the dominant Z-eigenvalue of the tensor: when this value crosses a threshold, the system moves from a low-cooperation equilibrium to a high-cooperation one. We prove an exact formula for how much any coalition shifts this value (Proposition 1 in the paper).
A formal game
Each country in the model is treated as a rational player in a well-defined game. Countries choose a level of climate cooperation (between 0 and 1), and their payoff depends on what other pairs of countries are doing — mediated through the tensor. The equilibria of this game are quantal response equilibria: players best-respond with a small amount of noise, reflecting the genuine uncertainty in diplomatic decision-making. Every stable point of the cooperation dynamics corresponds exactly to a Nash equilibrium of this game.
The data
Three datasets are combined to build the model:
| Dataset | What it provides | Coverage |
|---|---|---|
| IEA International Environmental Agreements Bellelli & Bernauer, 2021 |
Which countries ratified which multilateral environmental treaties | 175 non-G20 nations · 263 agreements · 1950–2017 |
| ND-GAIN Country Index University of Notre Dame |
Climate vulnerability and adaptive capacity scores | 175 countries |
| WRI Aqueduct 4.0 Kuzma et al., 2023 |
Baseline water stress by country | 175 countries |
Treaty ratification records are used to measure how aligned two countries are: if they consistently sign the same agreements, they are treated as strategically similar and likely to exert influence through shared channels. The vulnerability scores are combined into a single composite index that rewards including frontline-affected nations in any high-scoring coalition — embedding a climate-justice consideration directly into the scoring function.
An important caveat on the data: treaty co-ratification is a proxy, not direct evidence of diplomatic influence. Countries that consistently sign the same environmental agreements share interests and operate in overlapping networks — this is the best available long-run signal for strategic alignment. But co-signing a treaty is not the same as causally influencing another country's negotiating position. Throughout this research, "influence" means structural proximity in the treaty-ratification data, not a claim about what happens in the negotiating room.
Testing the model on simple systems
Before applying the framework to 175 countries, we verify it works as expected on small, fully controlled systems where we can check every calculation by hand.
Scope of these experiments: the figures in this section are generated from artificially constructed small systems — not real country data. Their purpose is to confirm that the mathematical mechanism behaves correctly: that tipping is genuine, that efficiency varies by structural position, and so on. They say nothing directly about which real-world countries are influential; that question is addressed in the sections below using the full 175-country dataset.
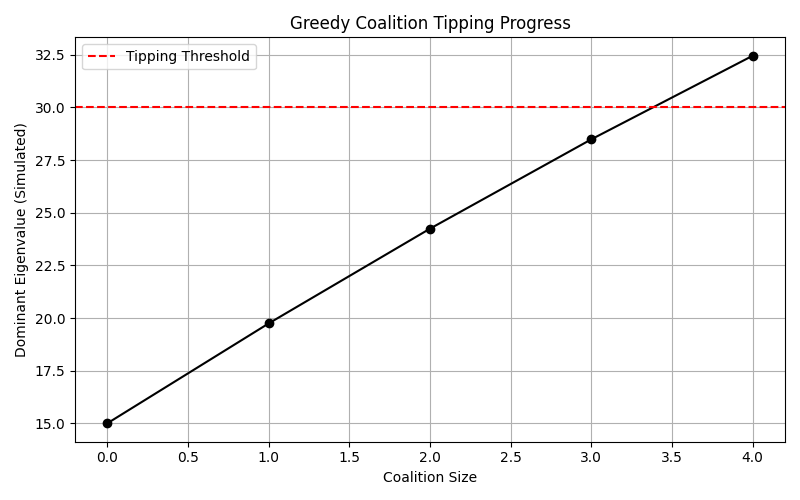
Does a small coalition actually tip the system?
In a five-player model, two players are designated as major actors (high-influence) and three as minor actors. When two minor players commit fully to cooperation and their tensor influence is amplified, the system's dominant eigenvalue jumps from 17.74 to 32.45 — a modelled transition to a higher-cooperation equilibrium.
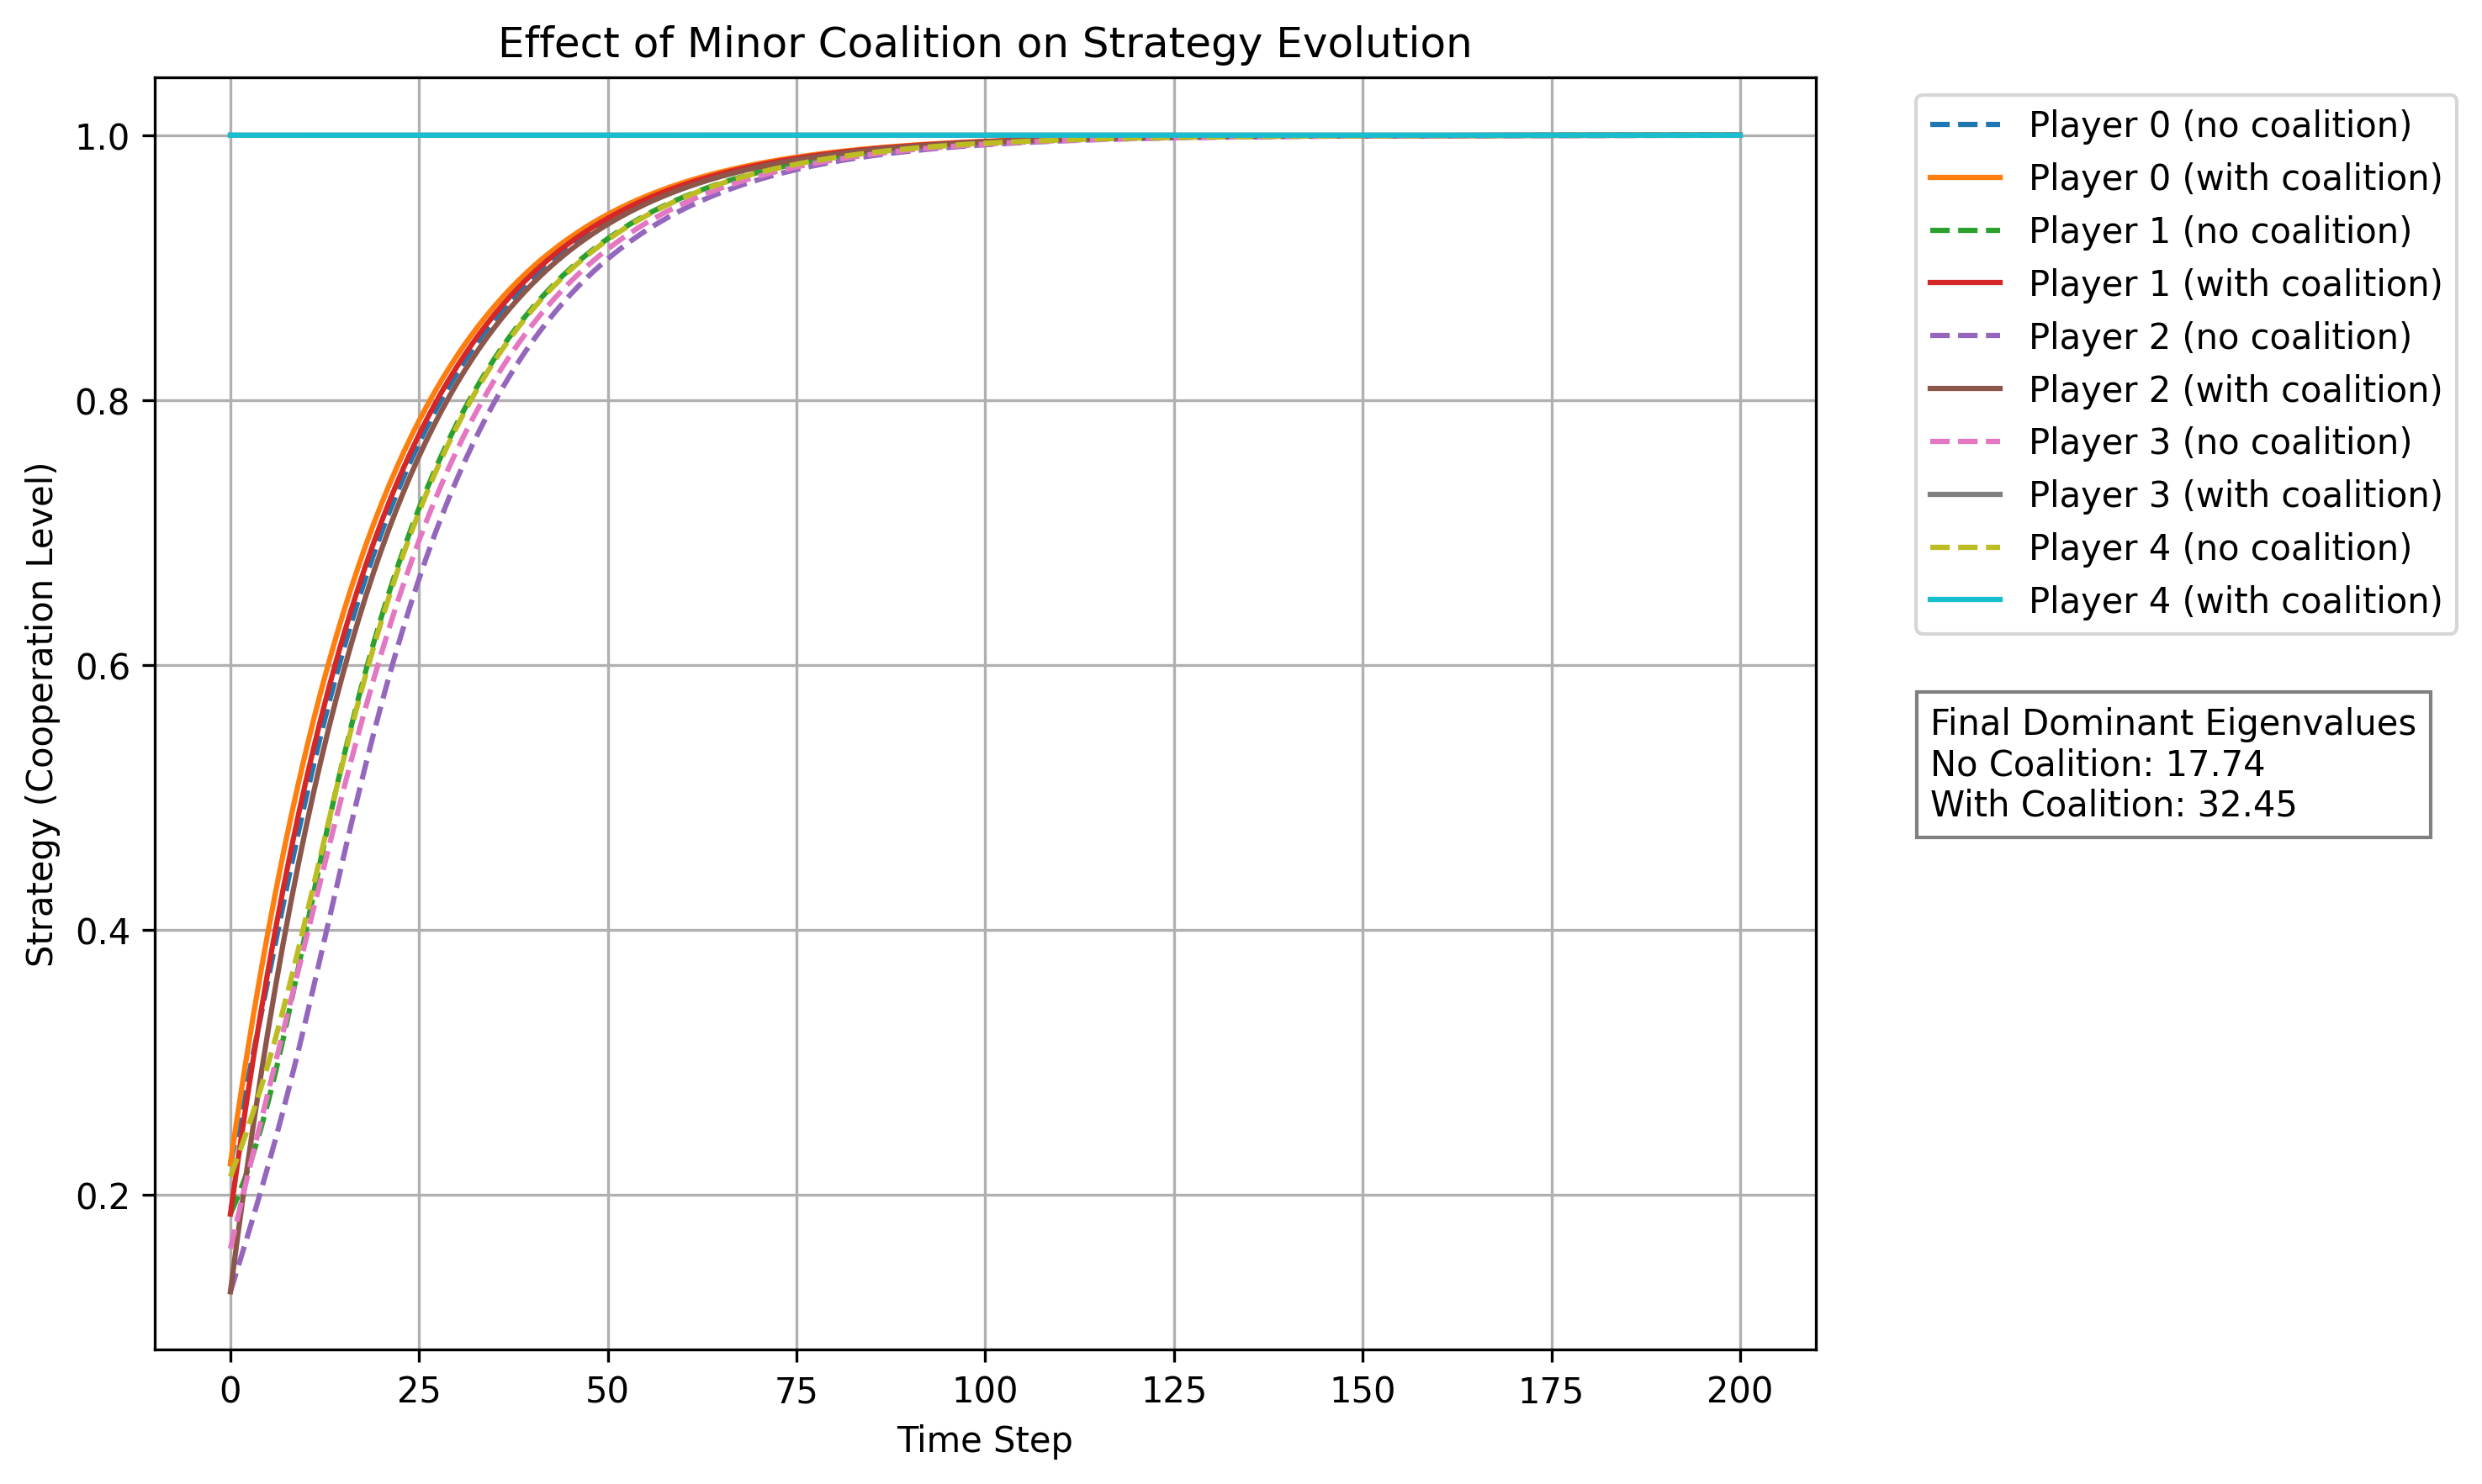
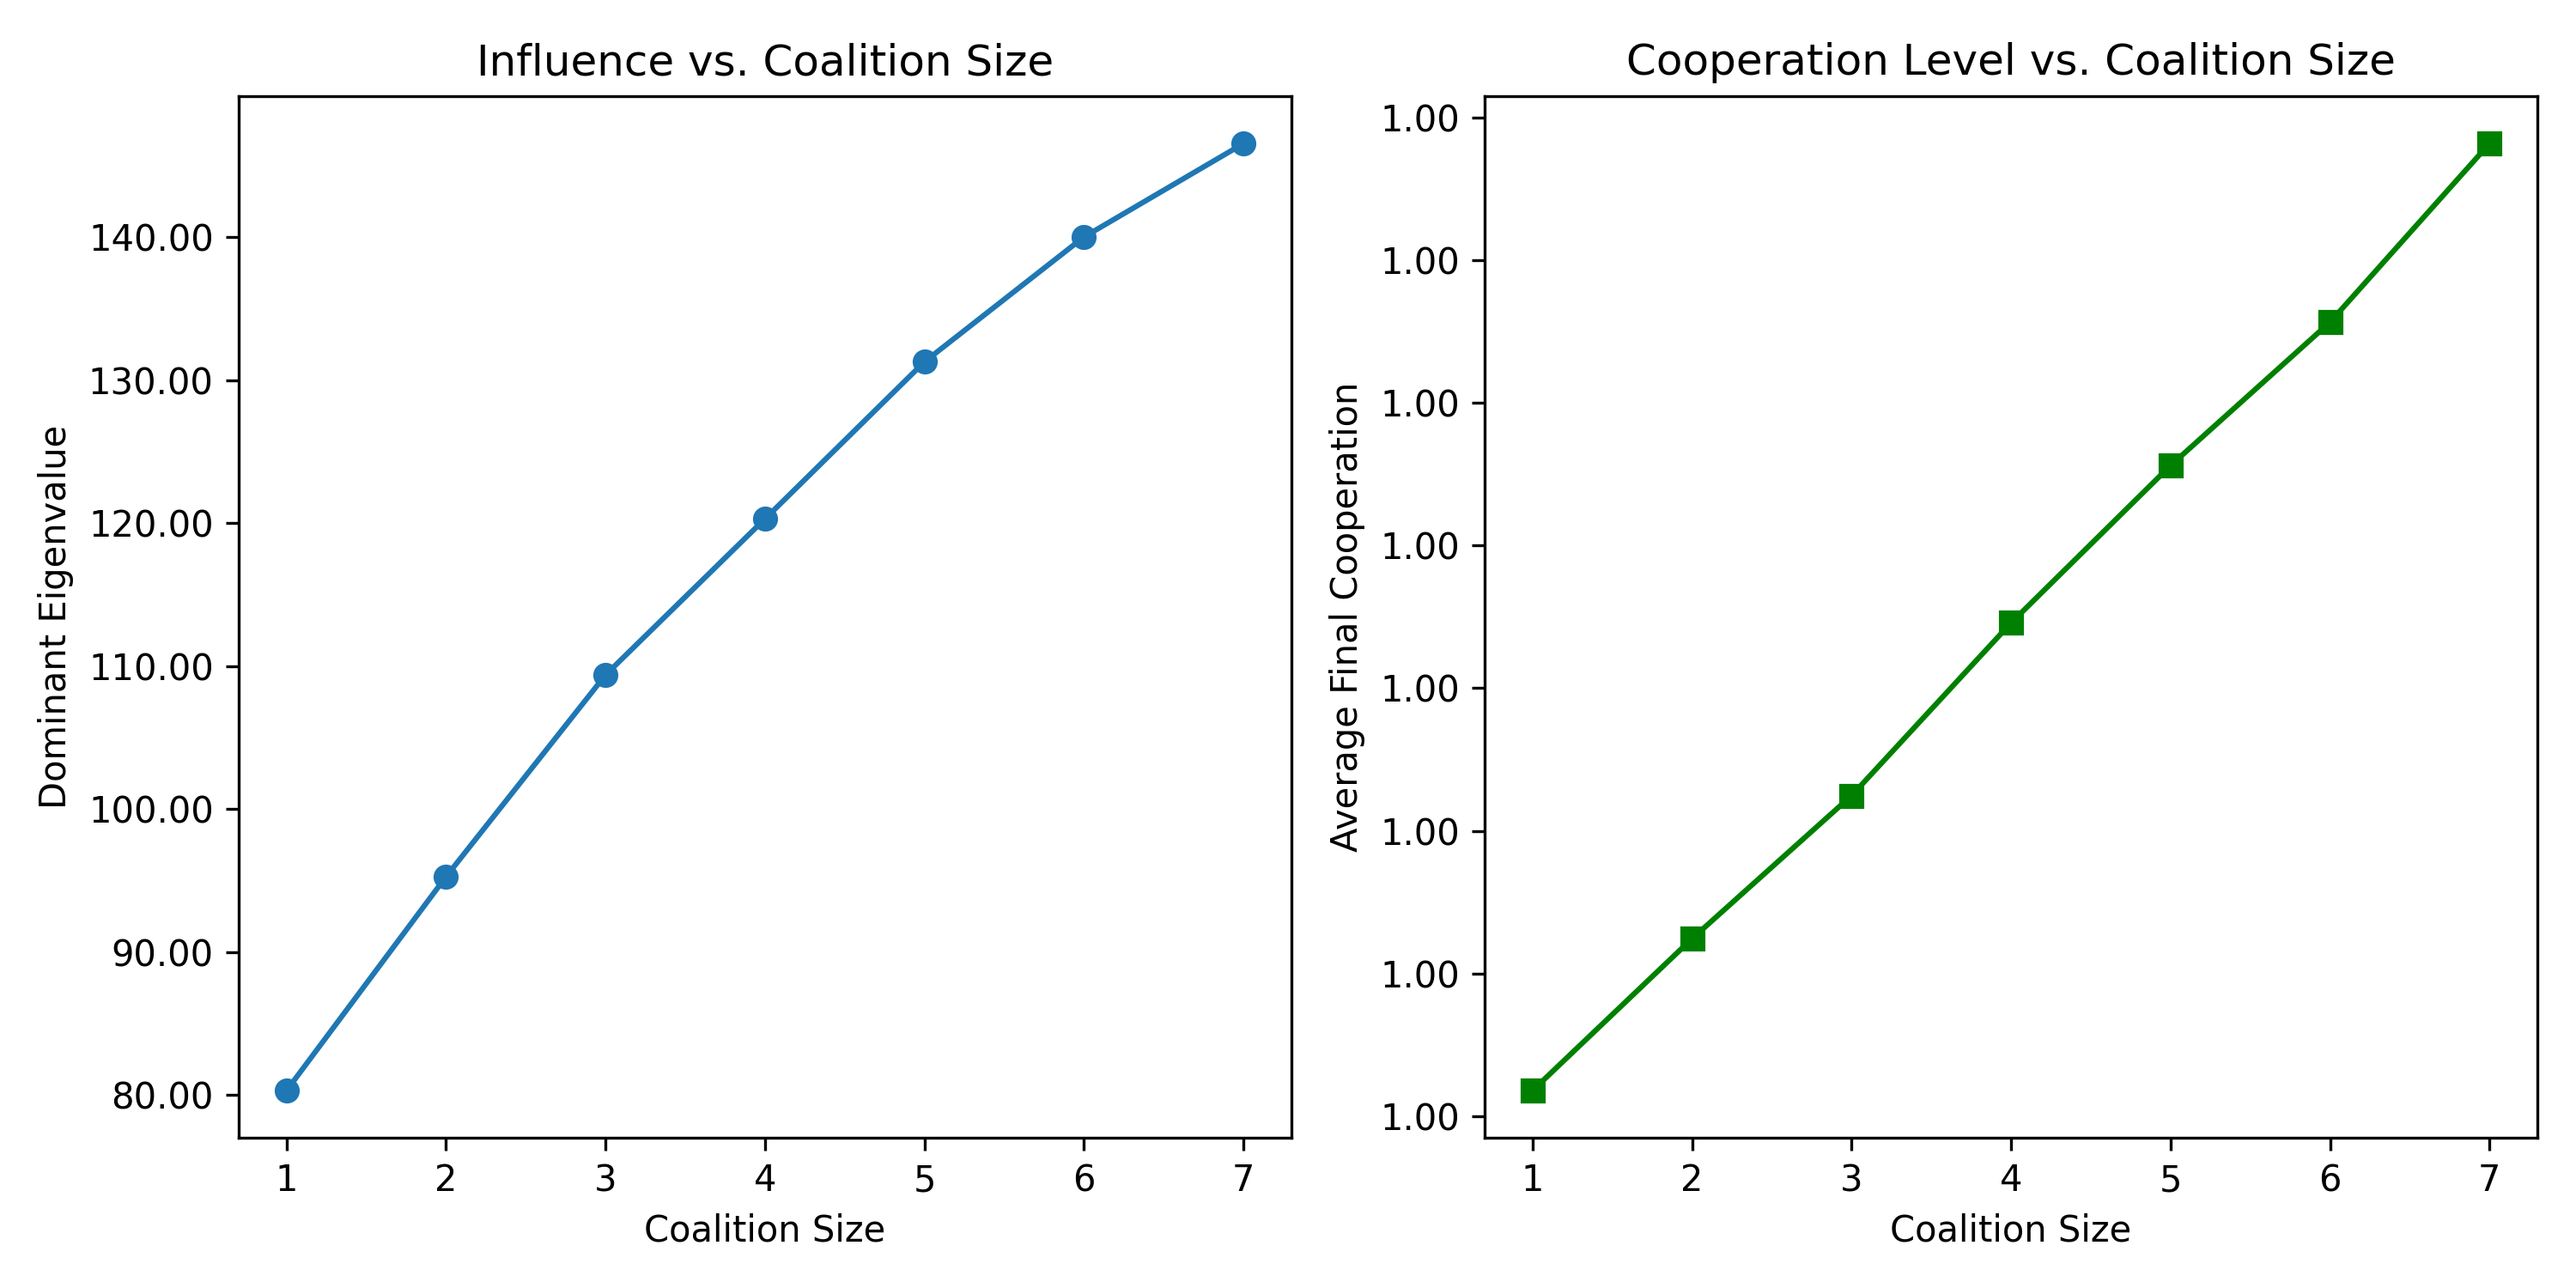
How does coalition size affect leverage?
We then run the same experiment across all coalition sizes in a ten-player system, tracking both the dominant eigenvalue and the average final cooperation level.
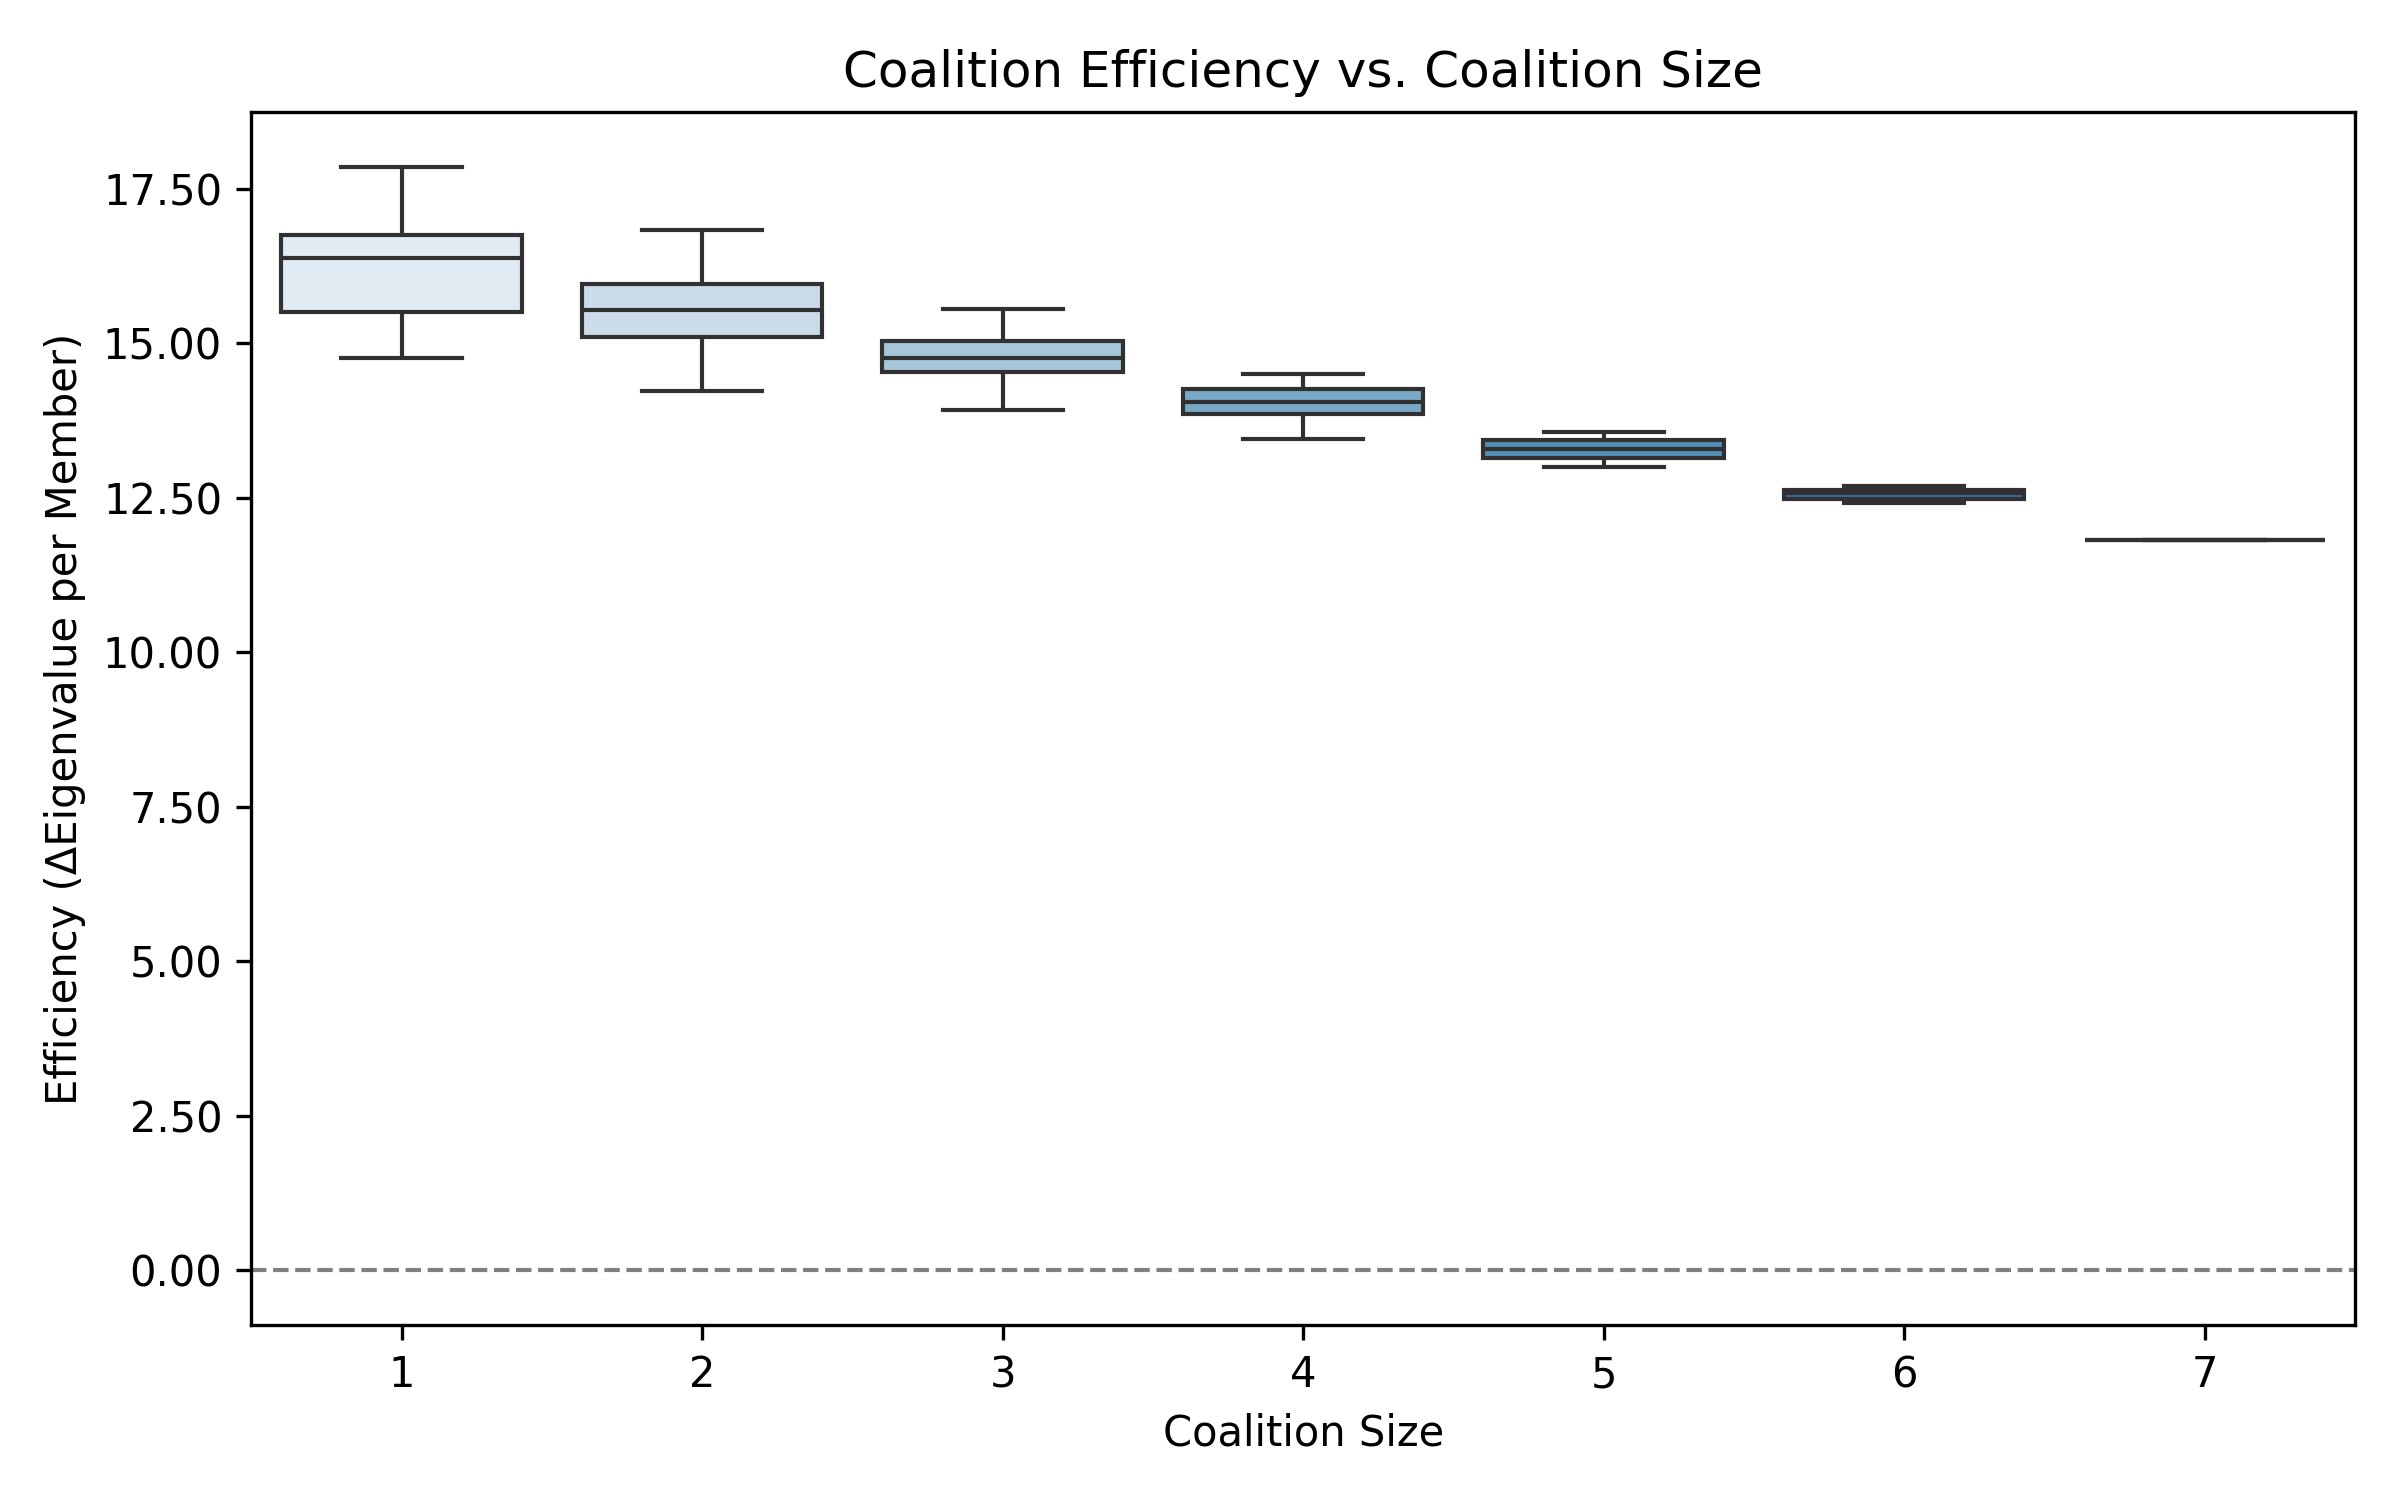
Efficiency: which coalitions do more with fewer members?
Not all coalitions of the same size are equally powerful. We define efficiency as the eigenvalue gain per member. Smaller coalitions are often more efficient — confirming that strategic position matters more than headcount.
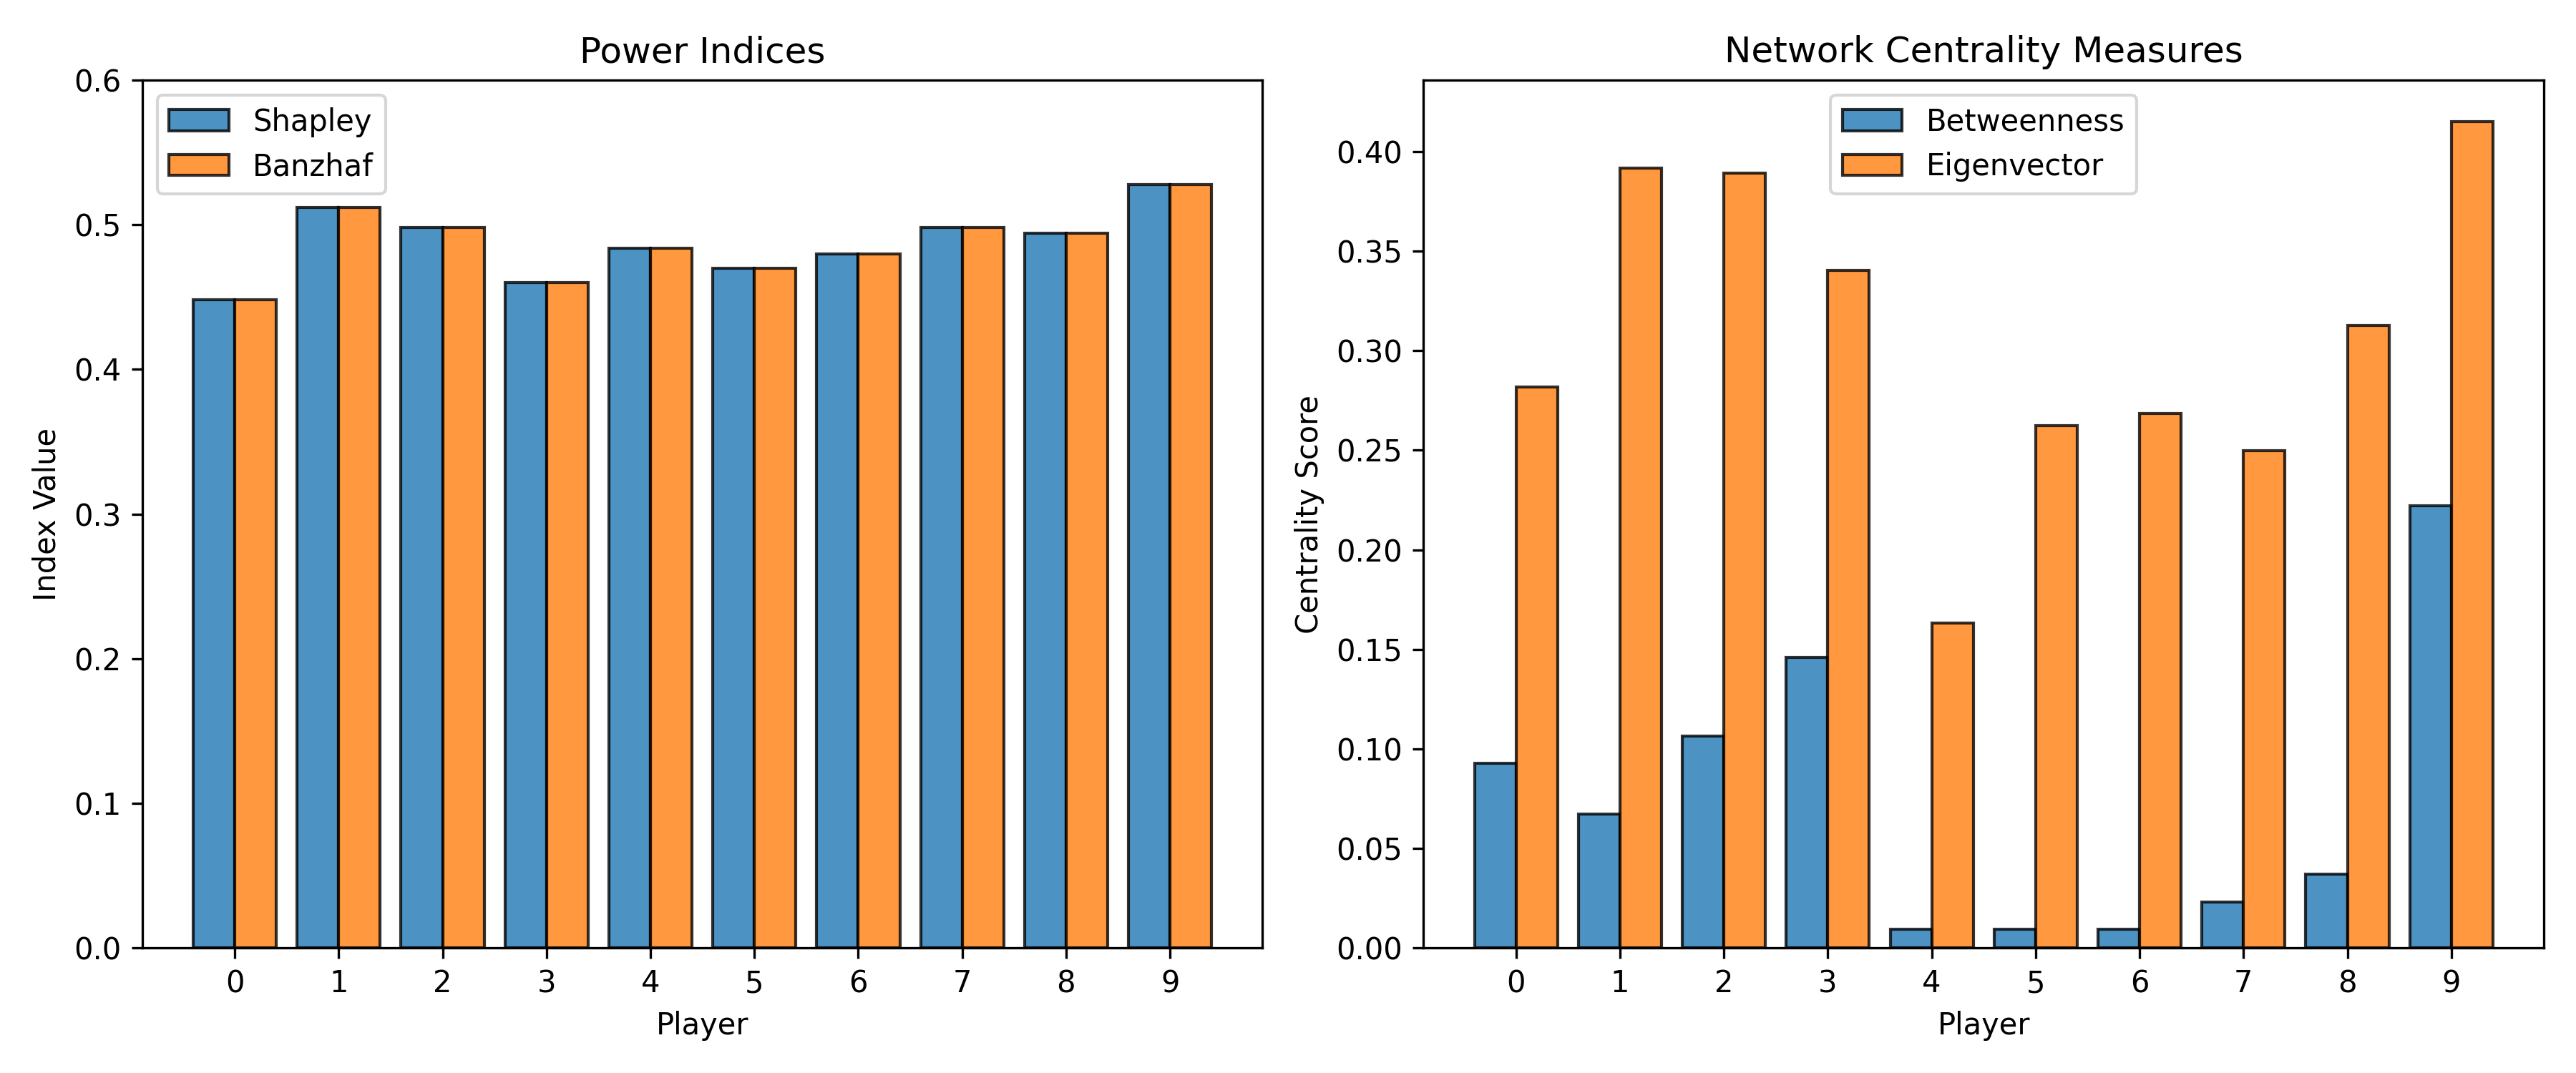
Who is pivotal? Power indices and network centrality
We compute two classic game-theory measures of pivotality — Shapley values and Banzhaf indices — alongside network centrality metrics. Players that score highly on both are structurally positioned to shift coalition outcomes.
Grouping countries by treaty history
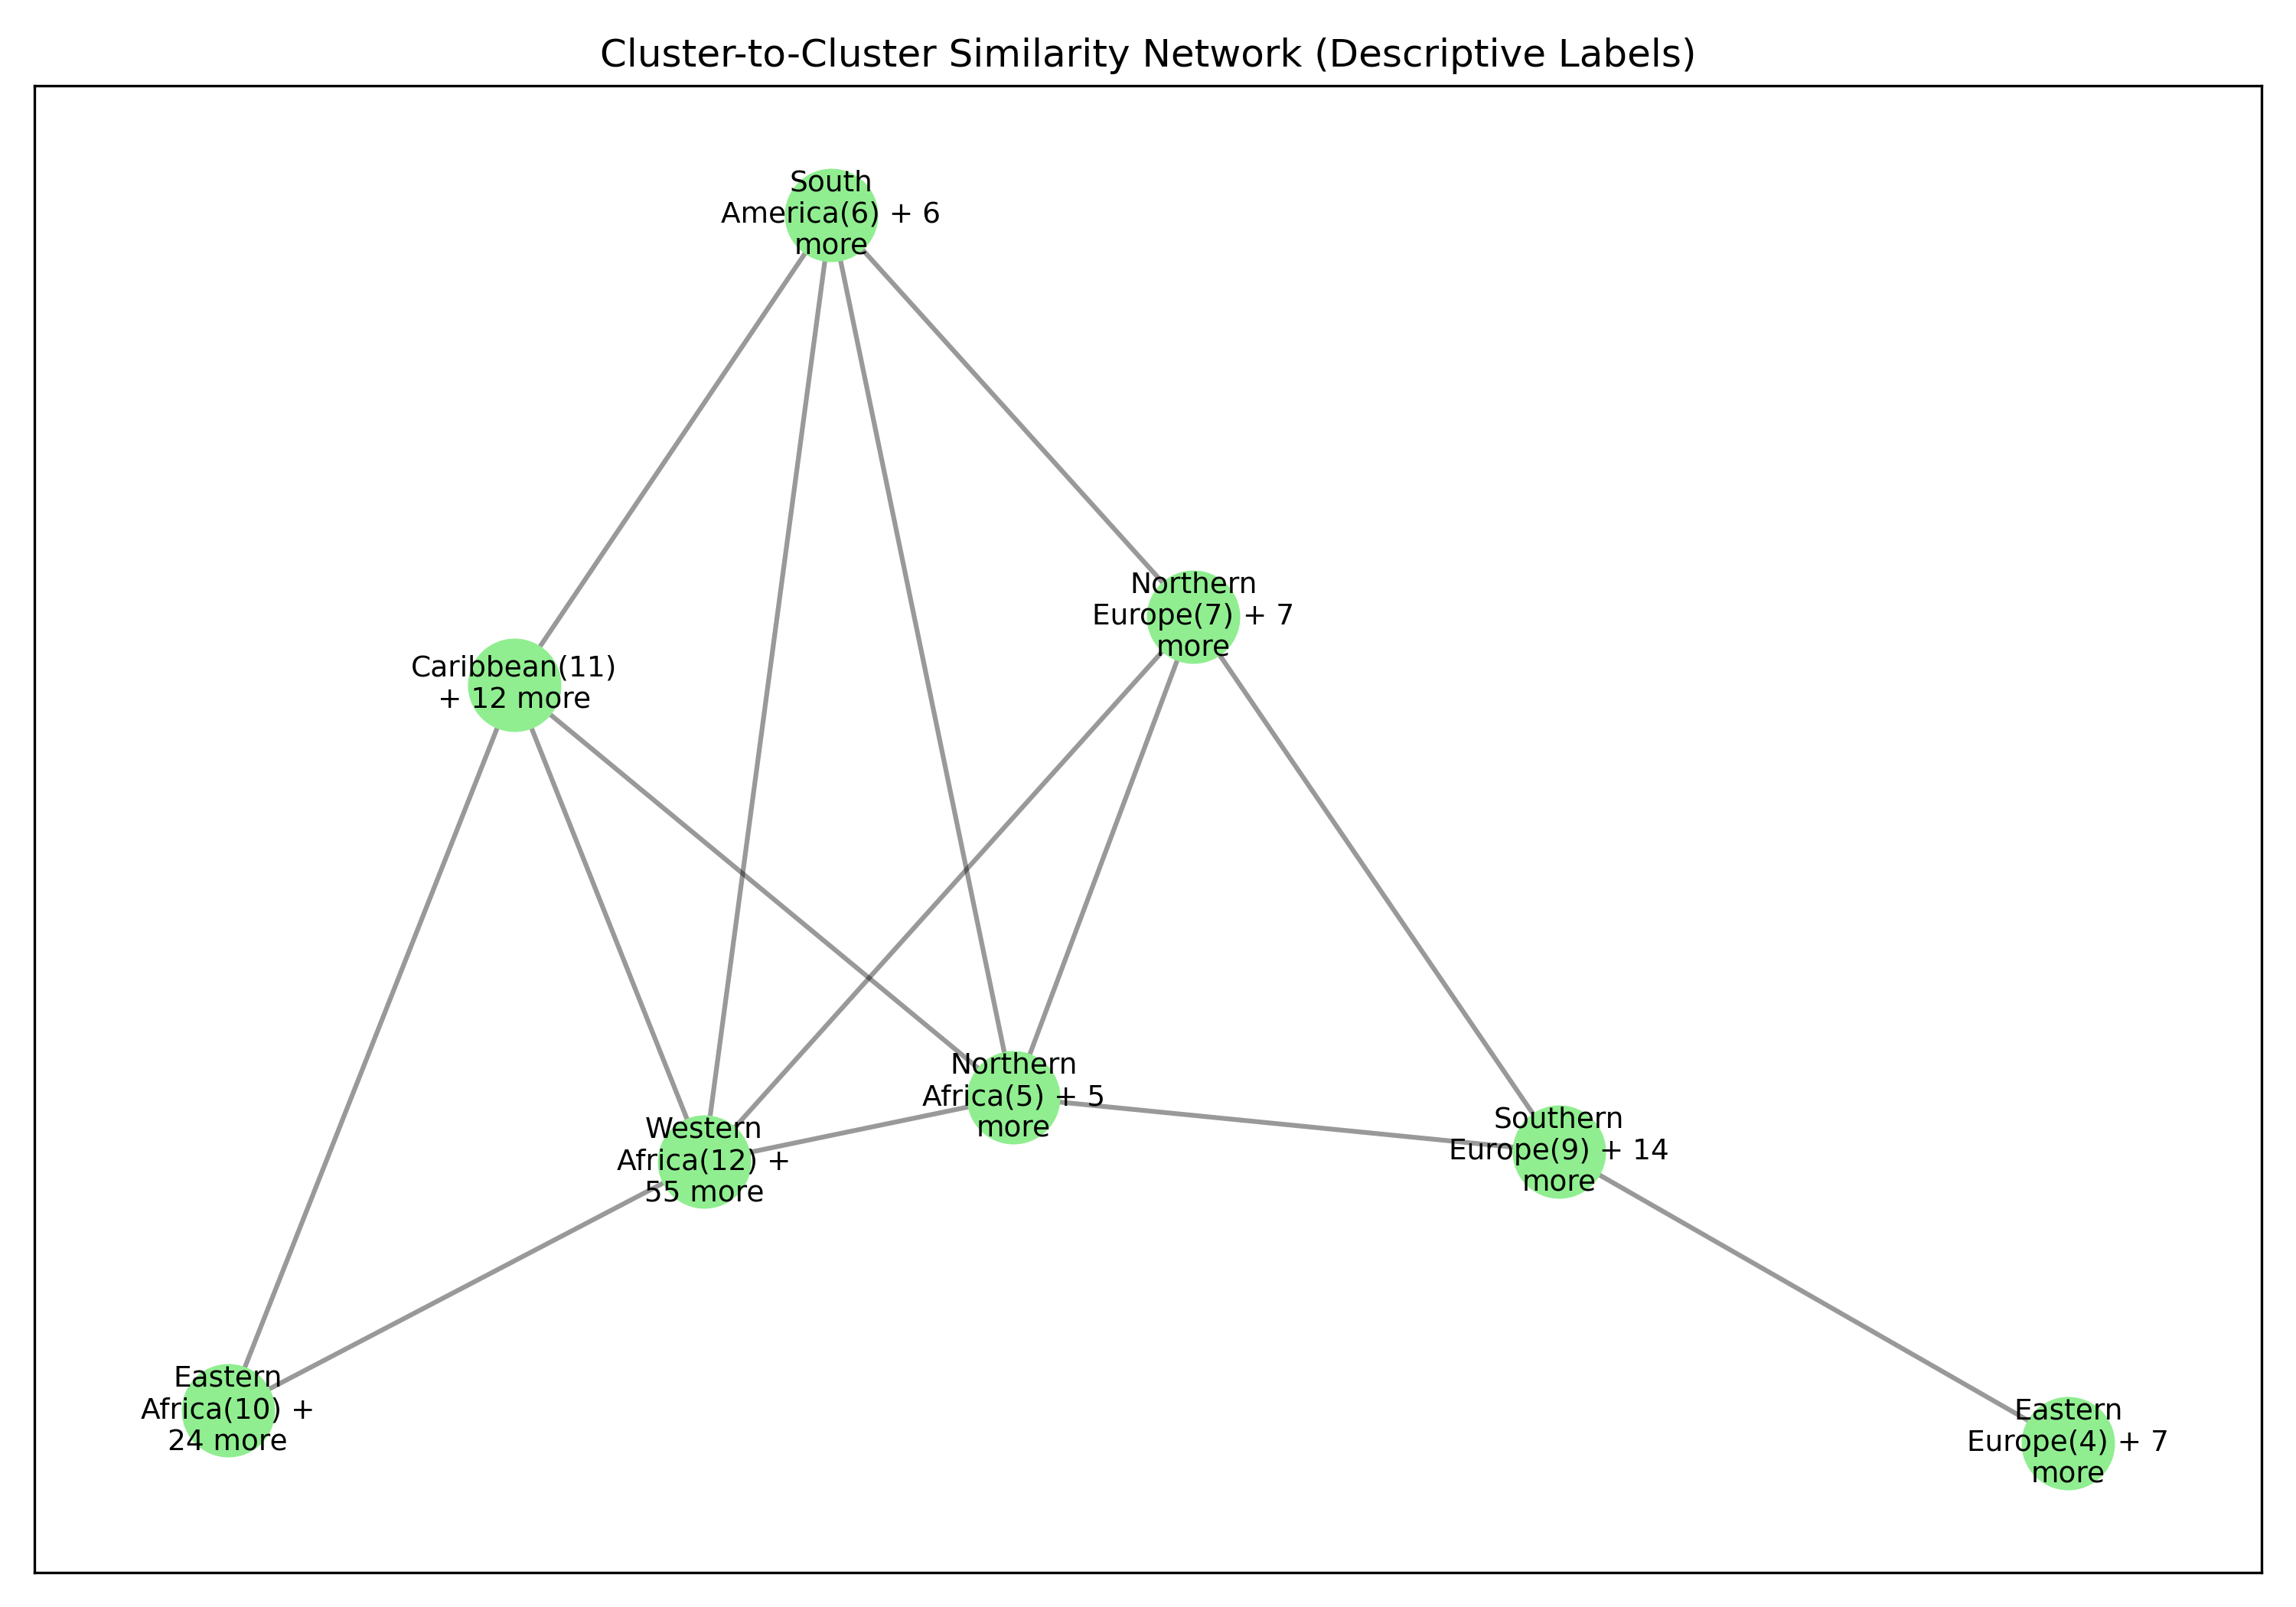
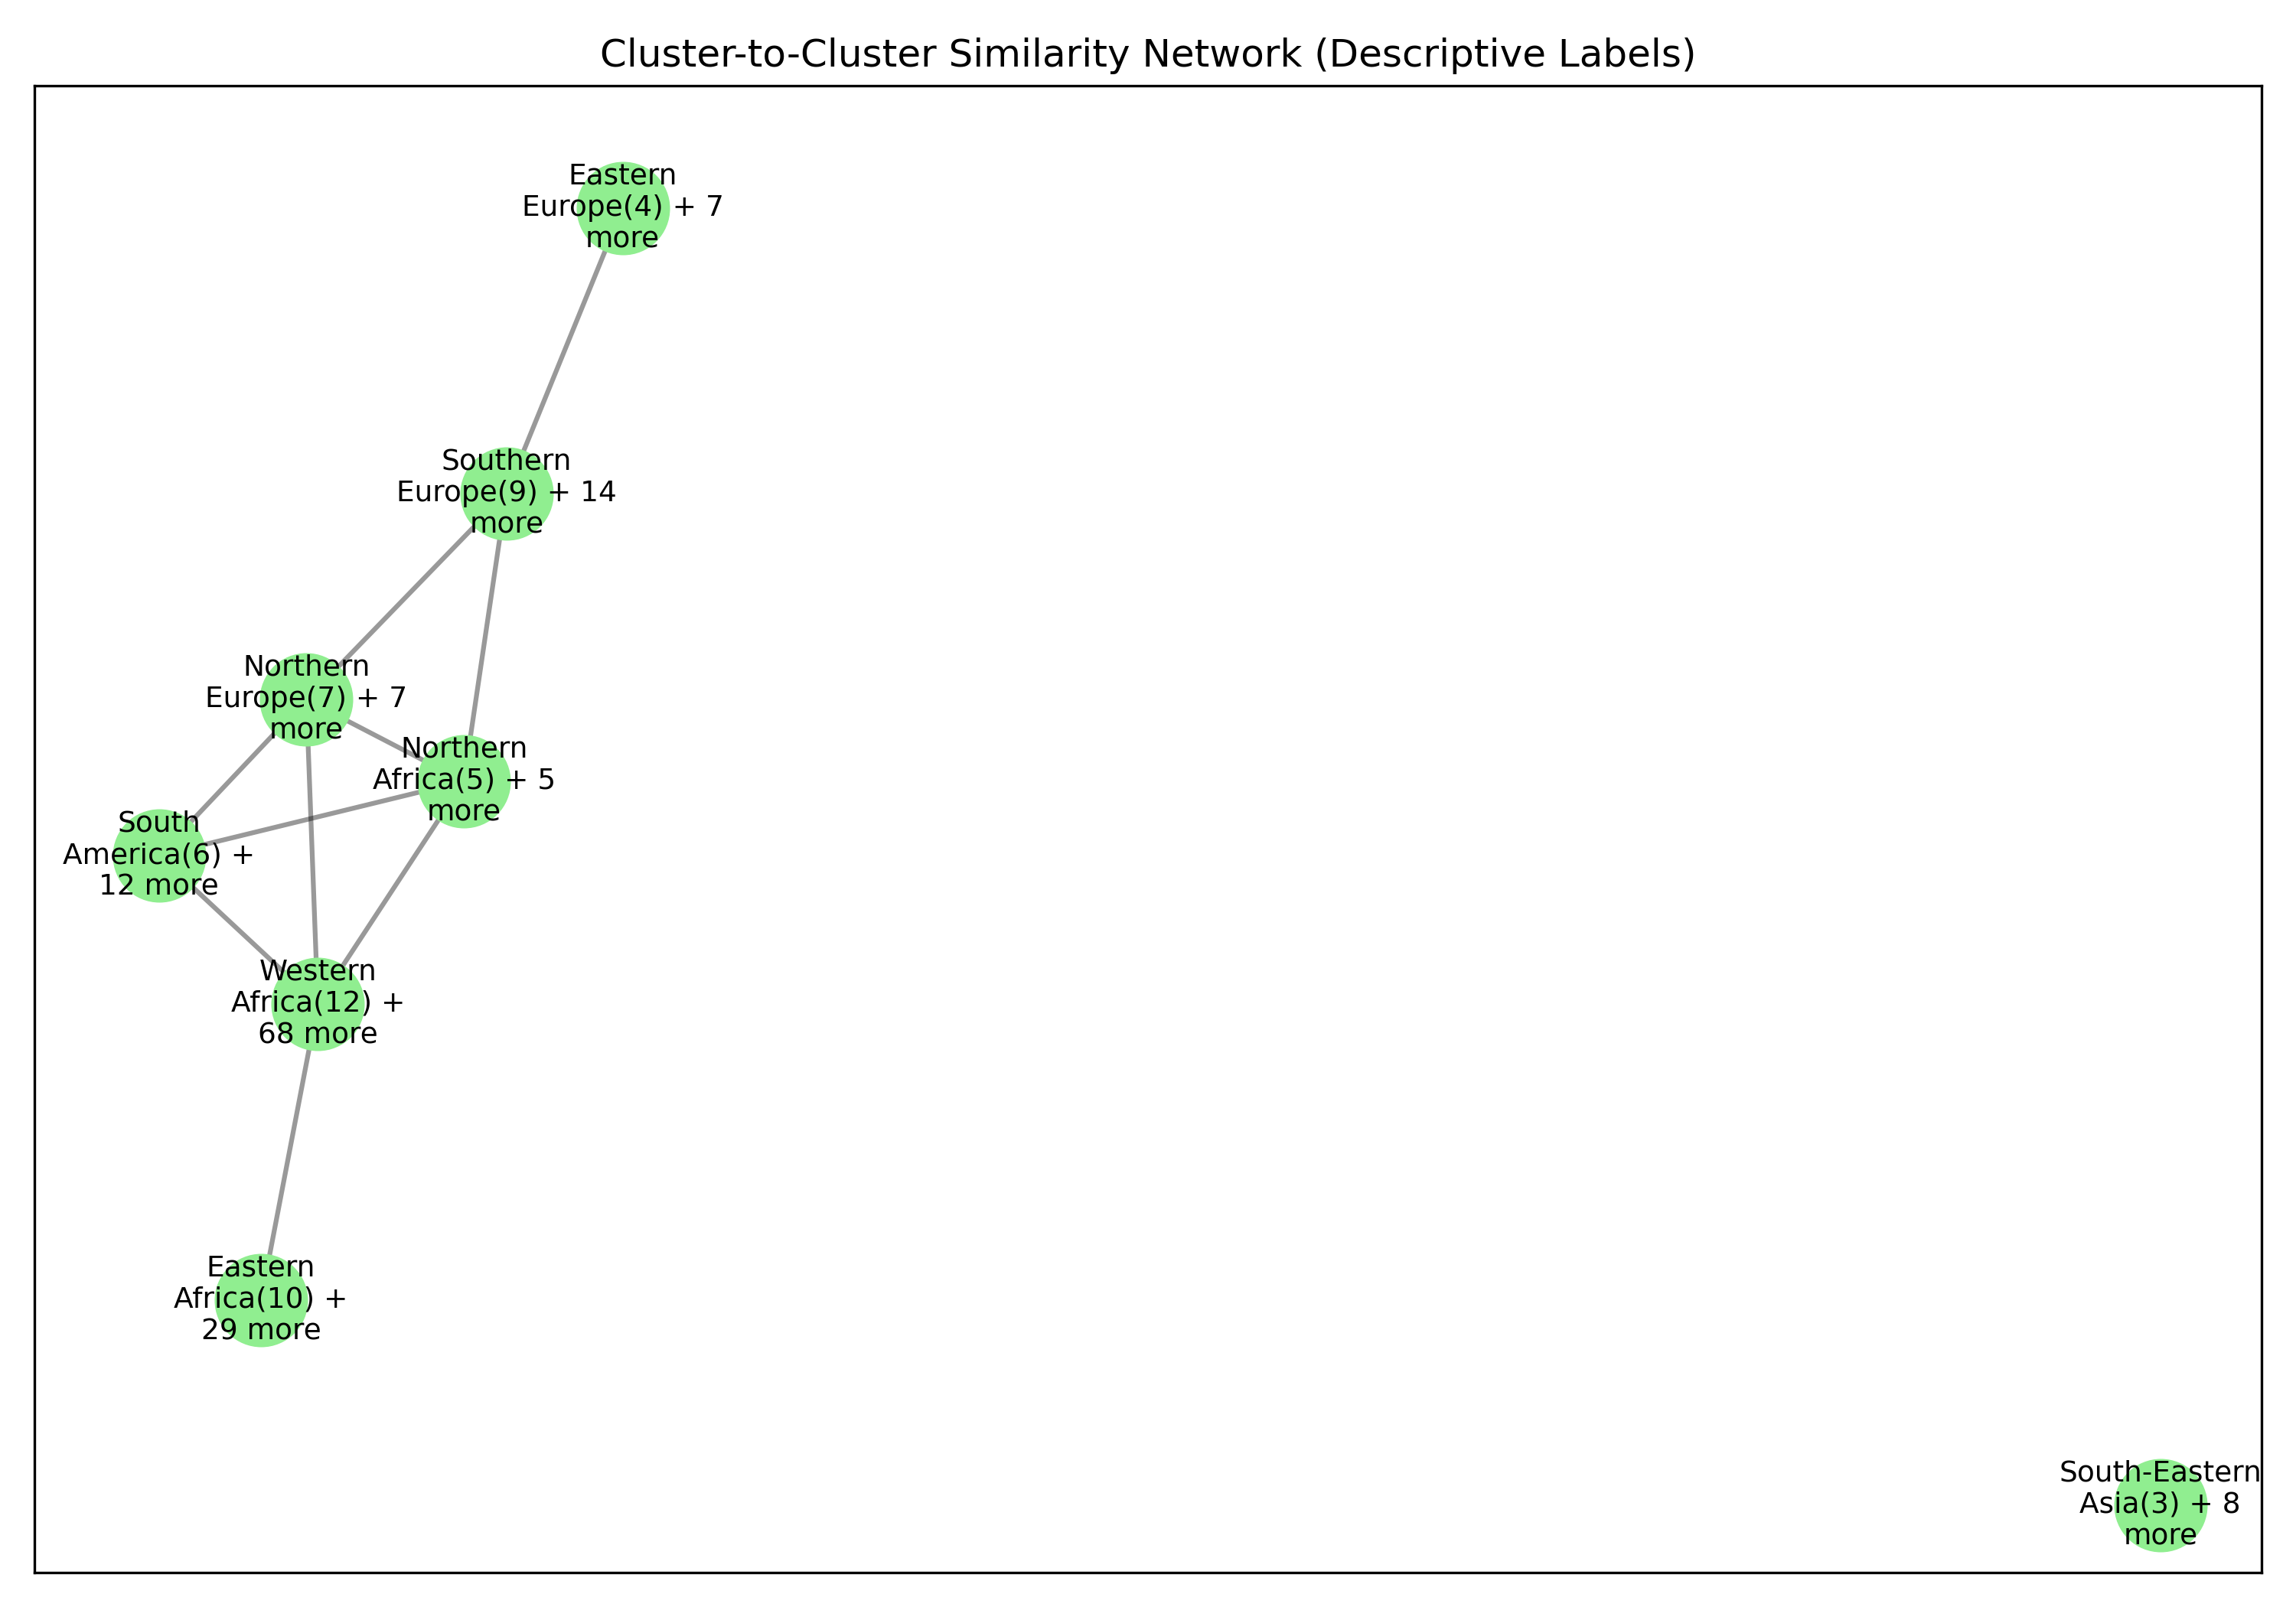
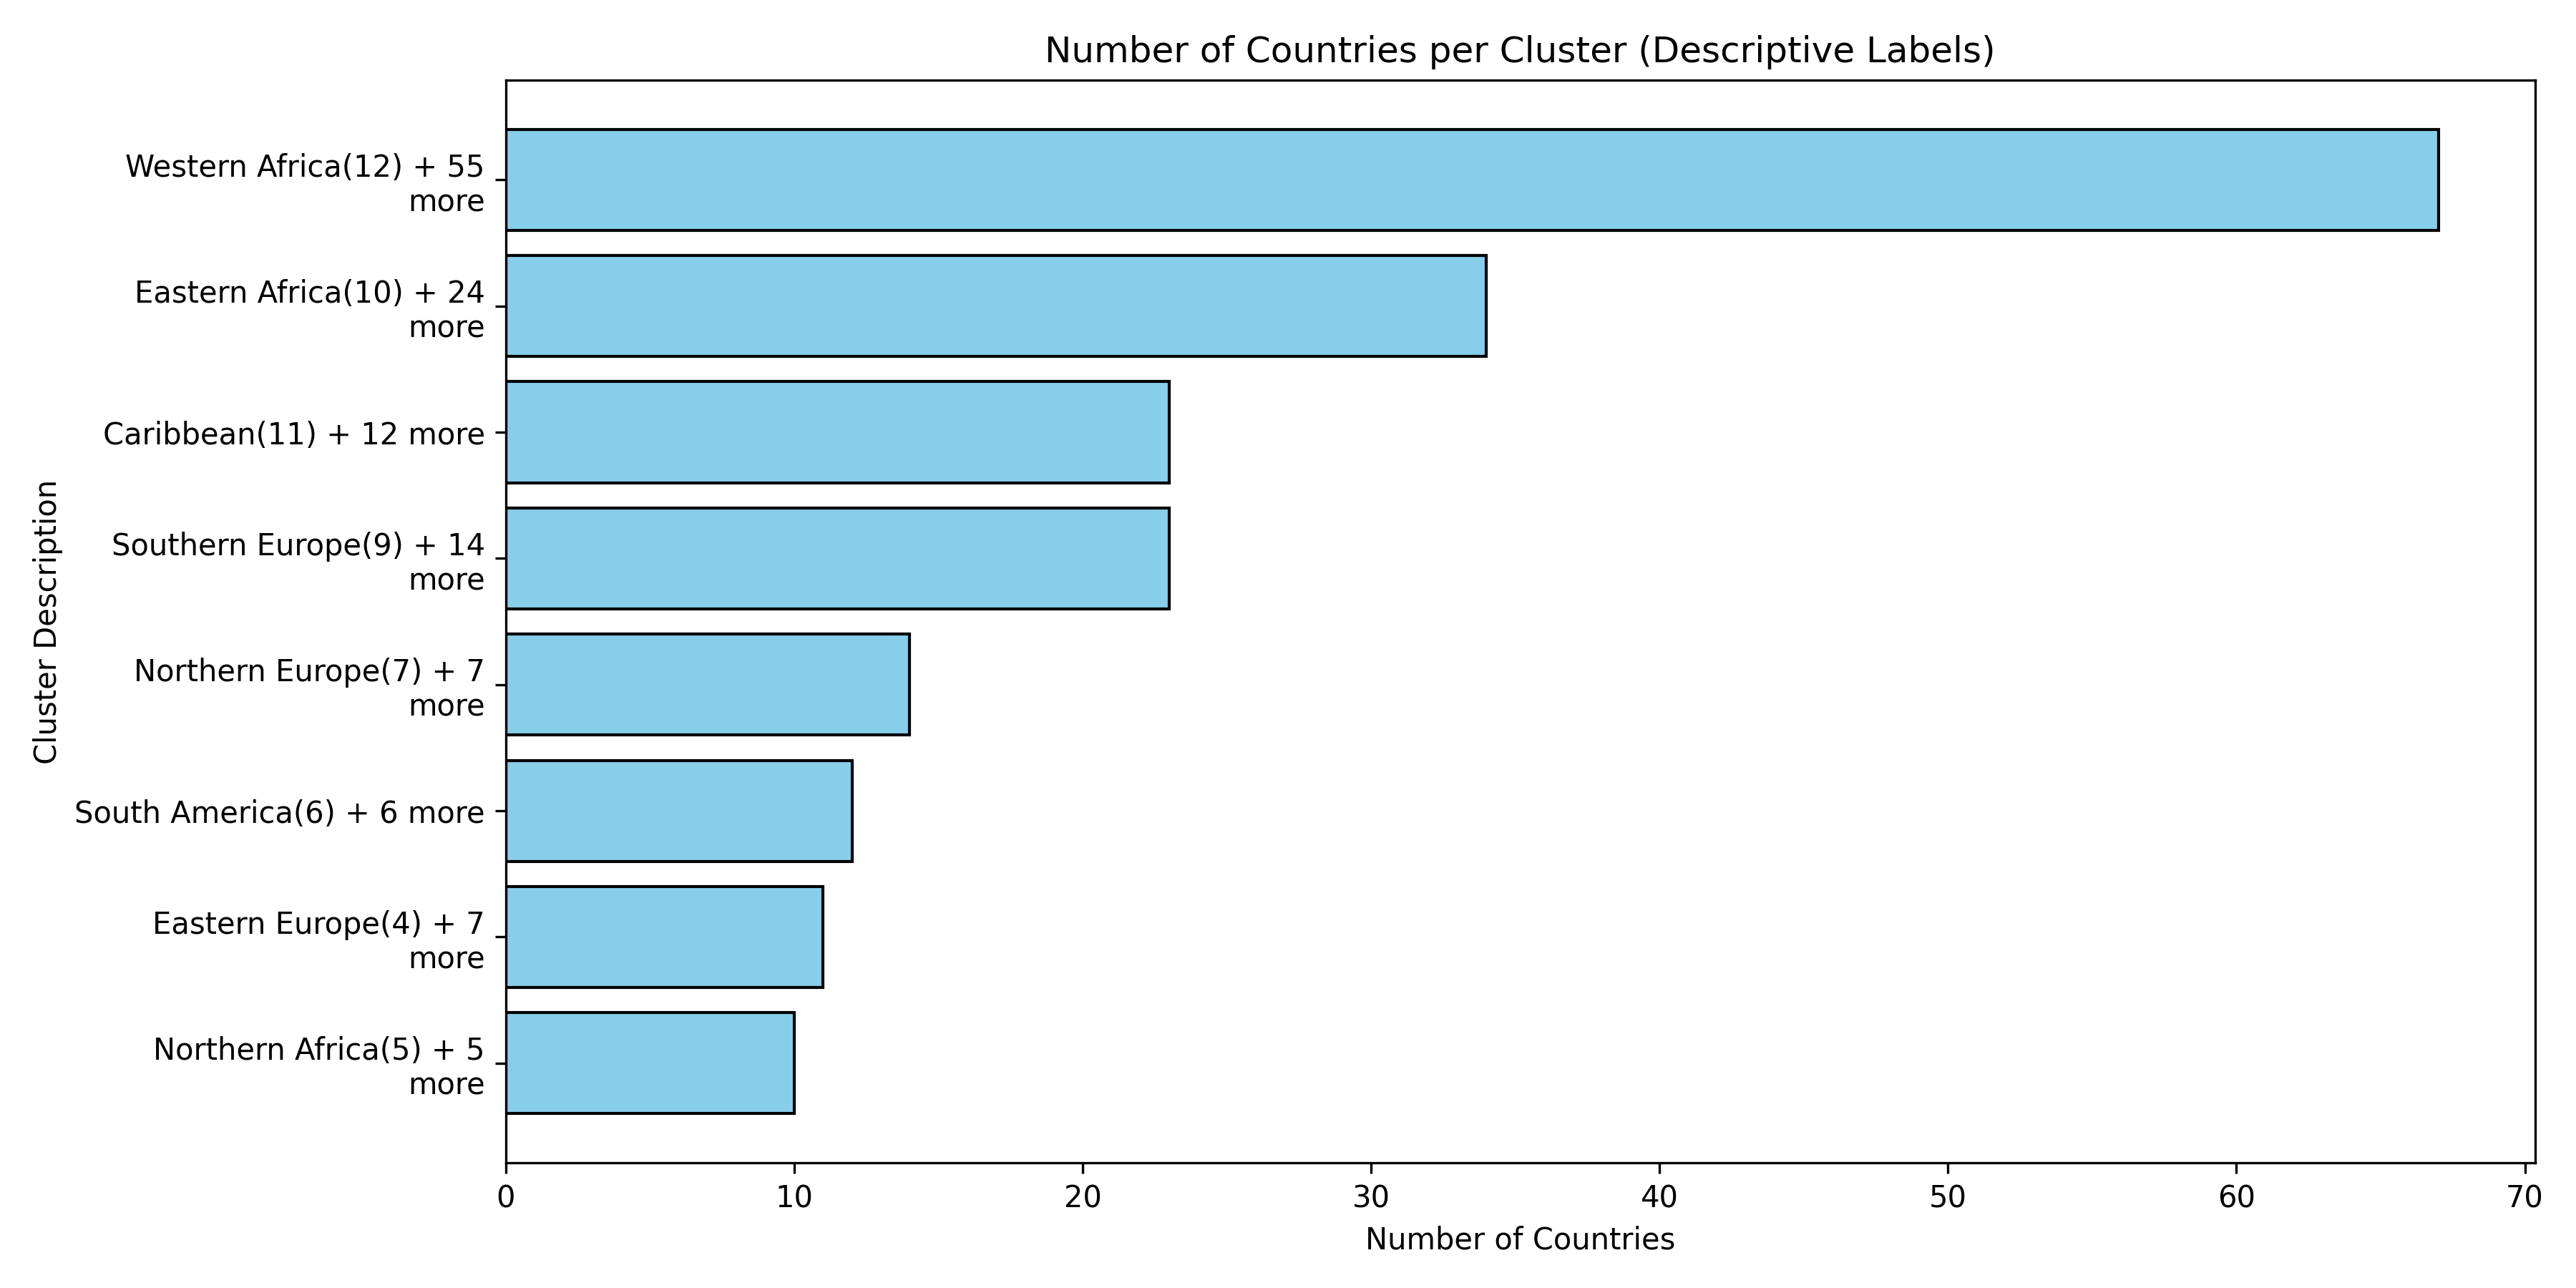
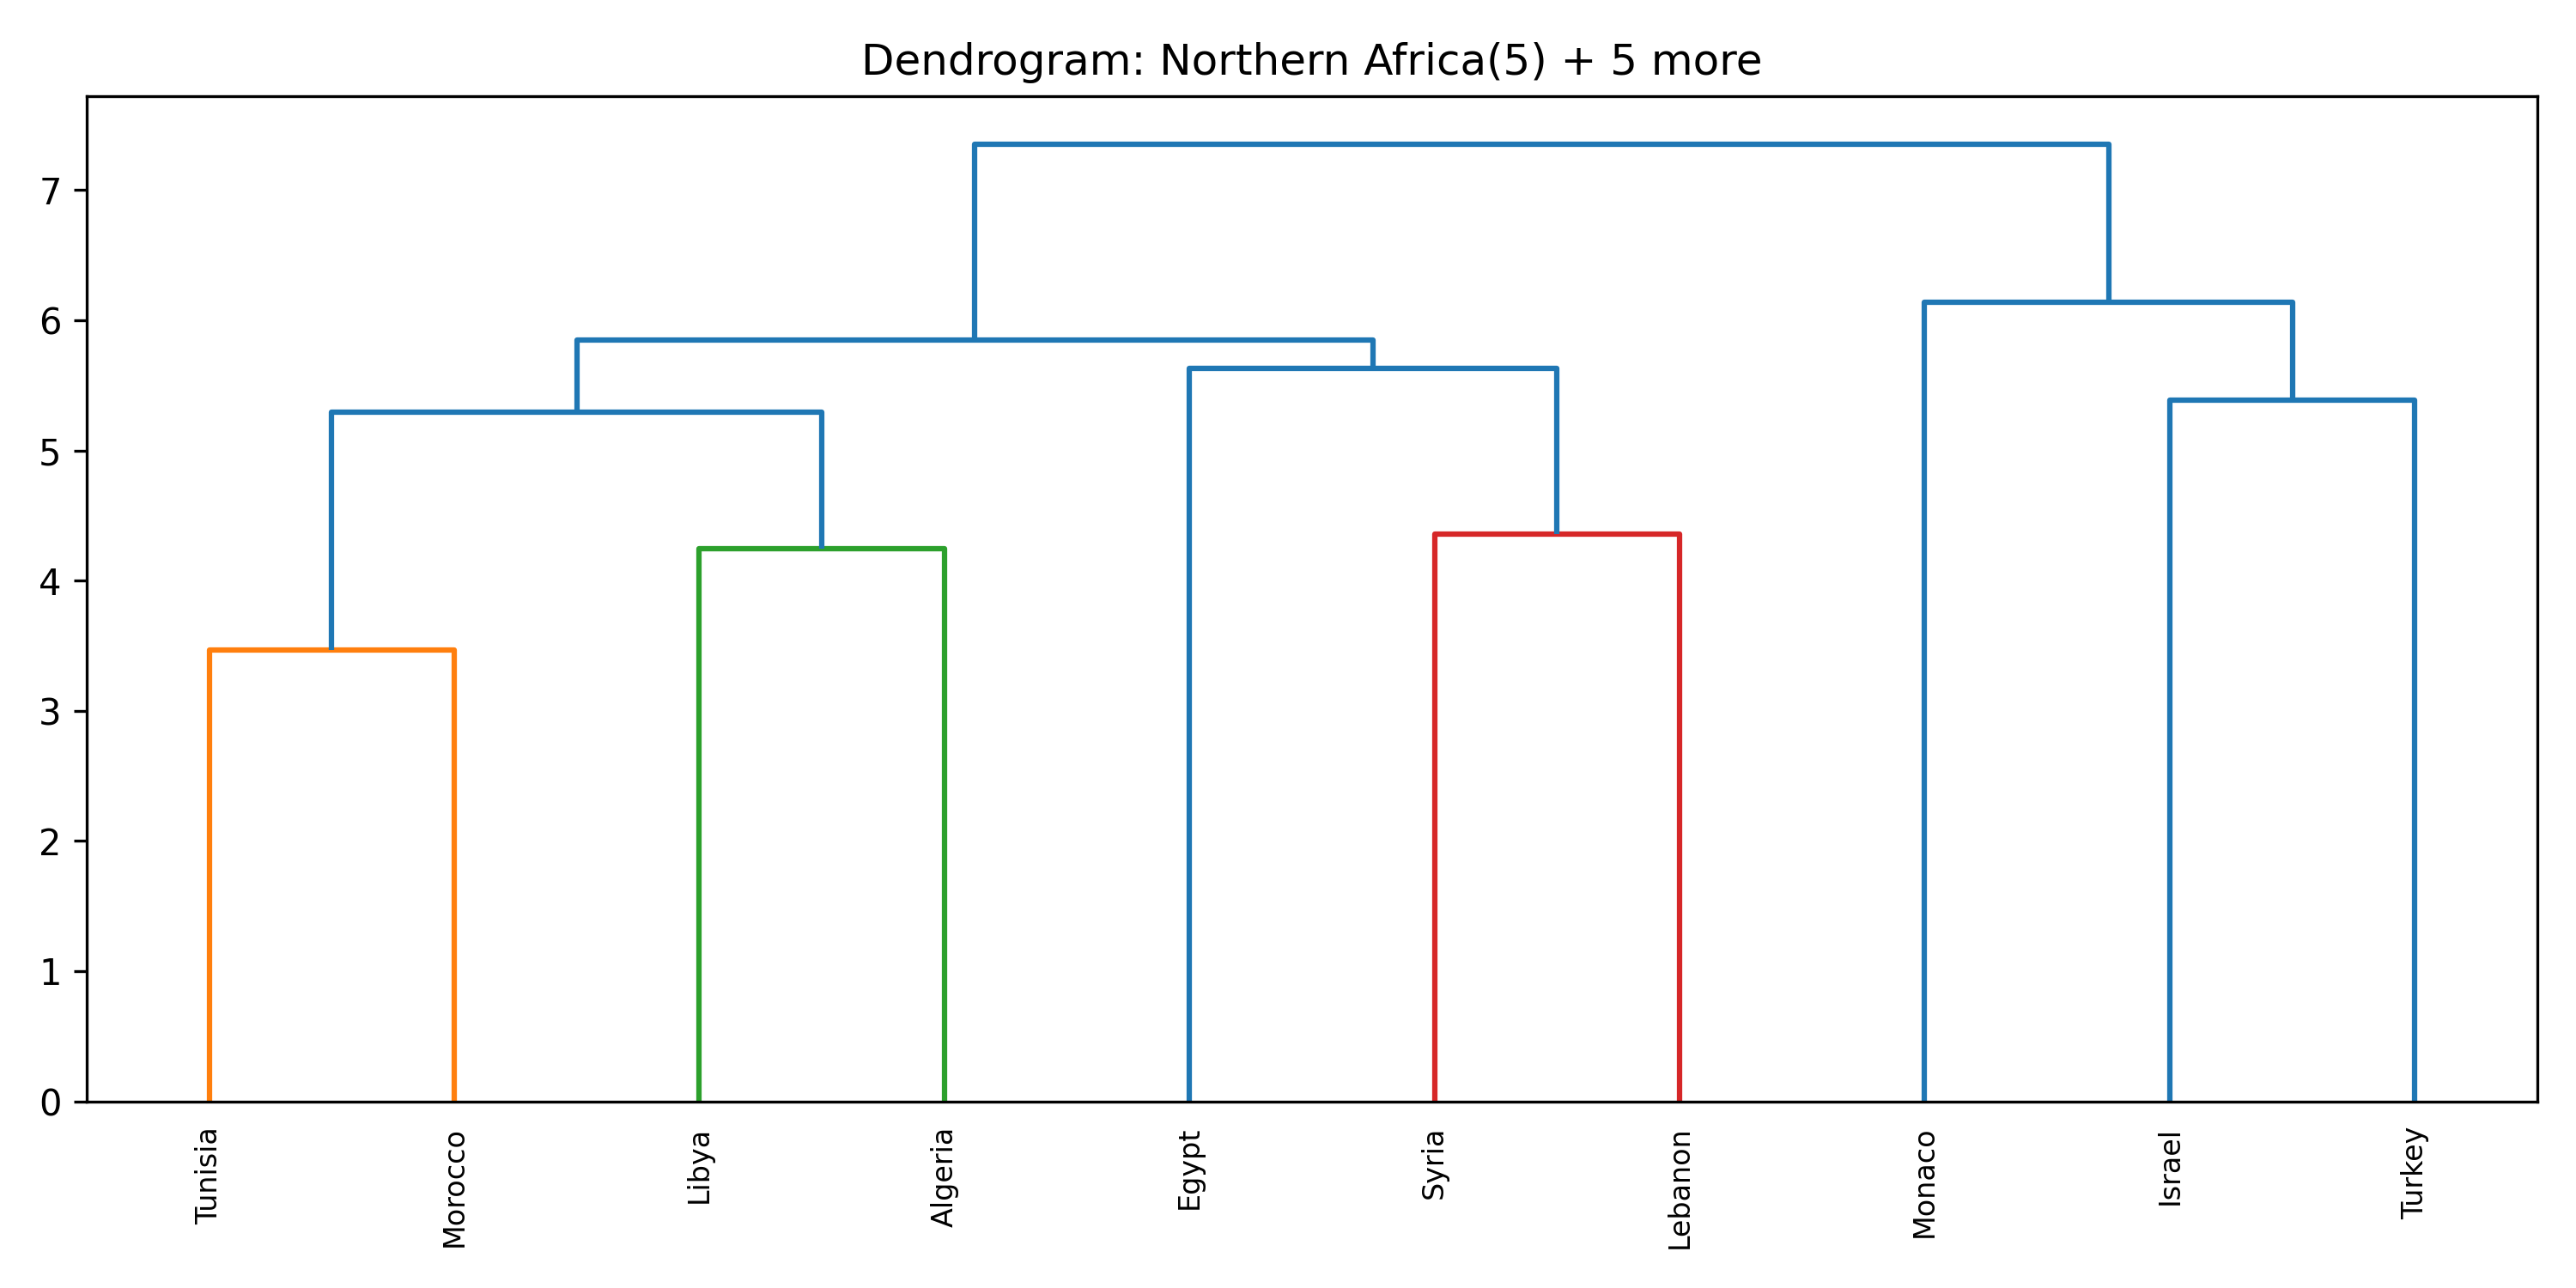
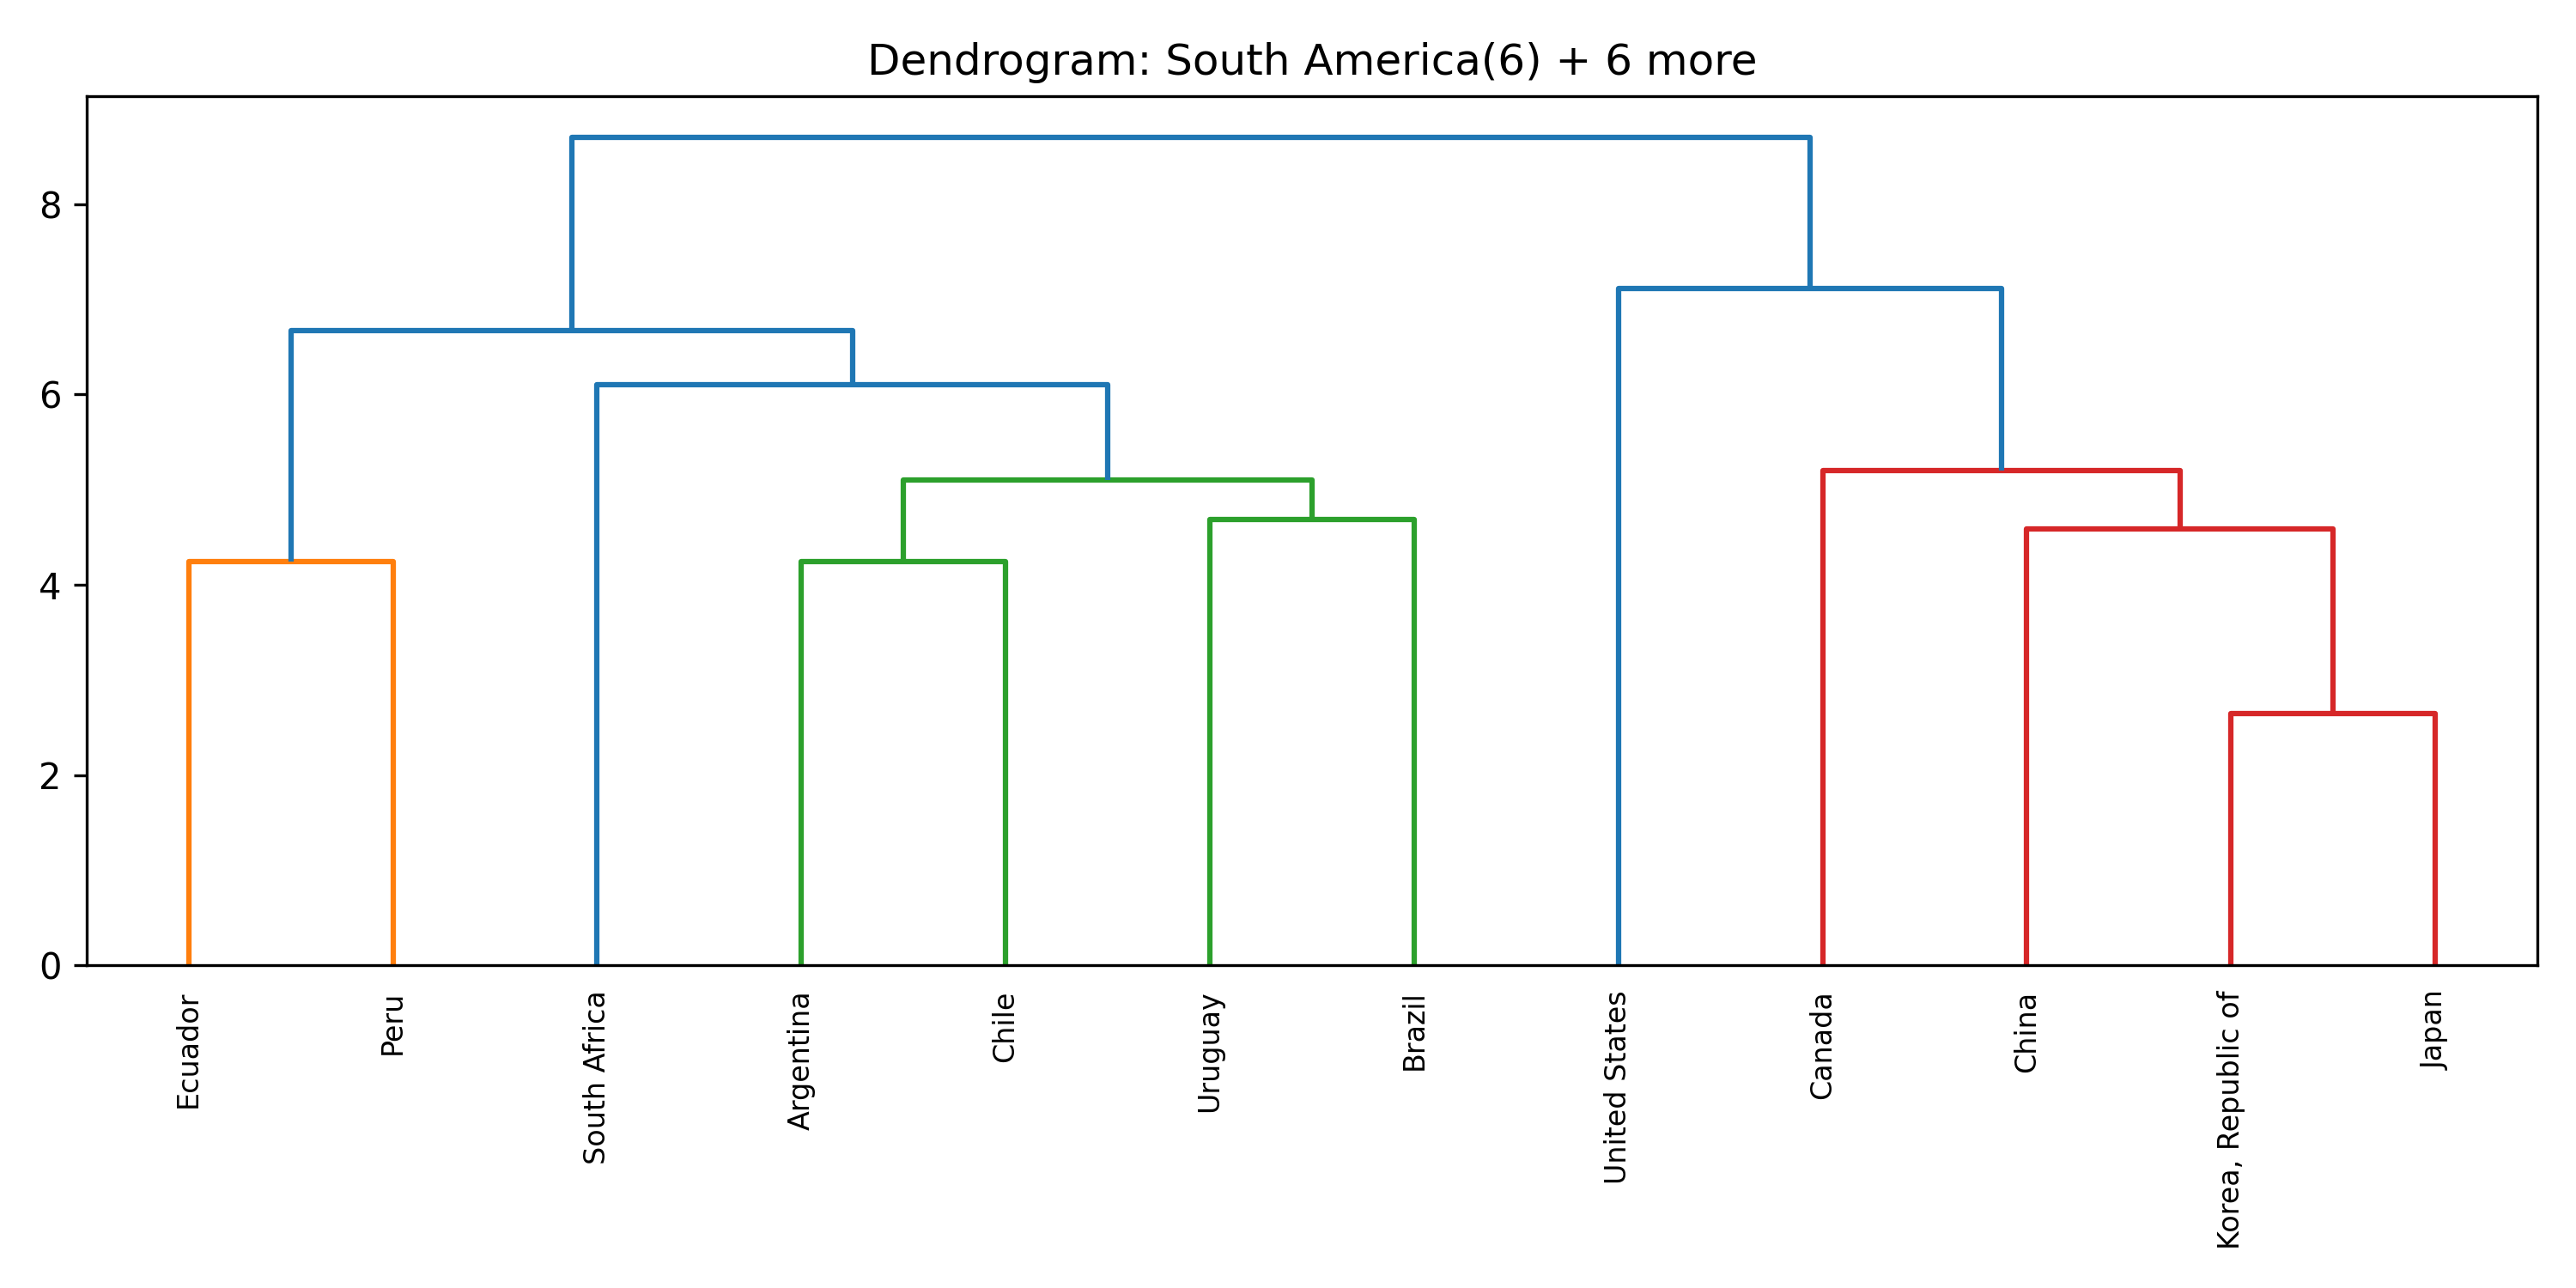
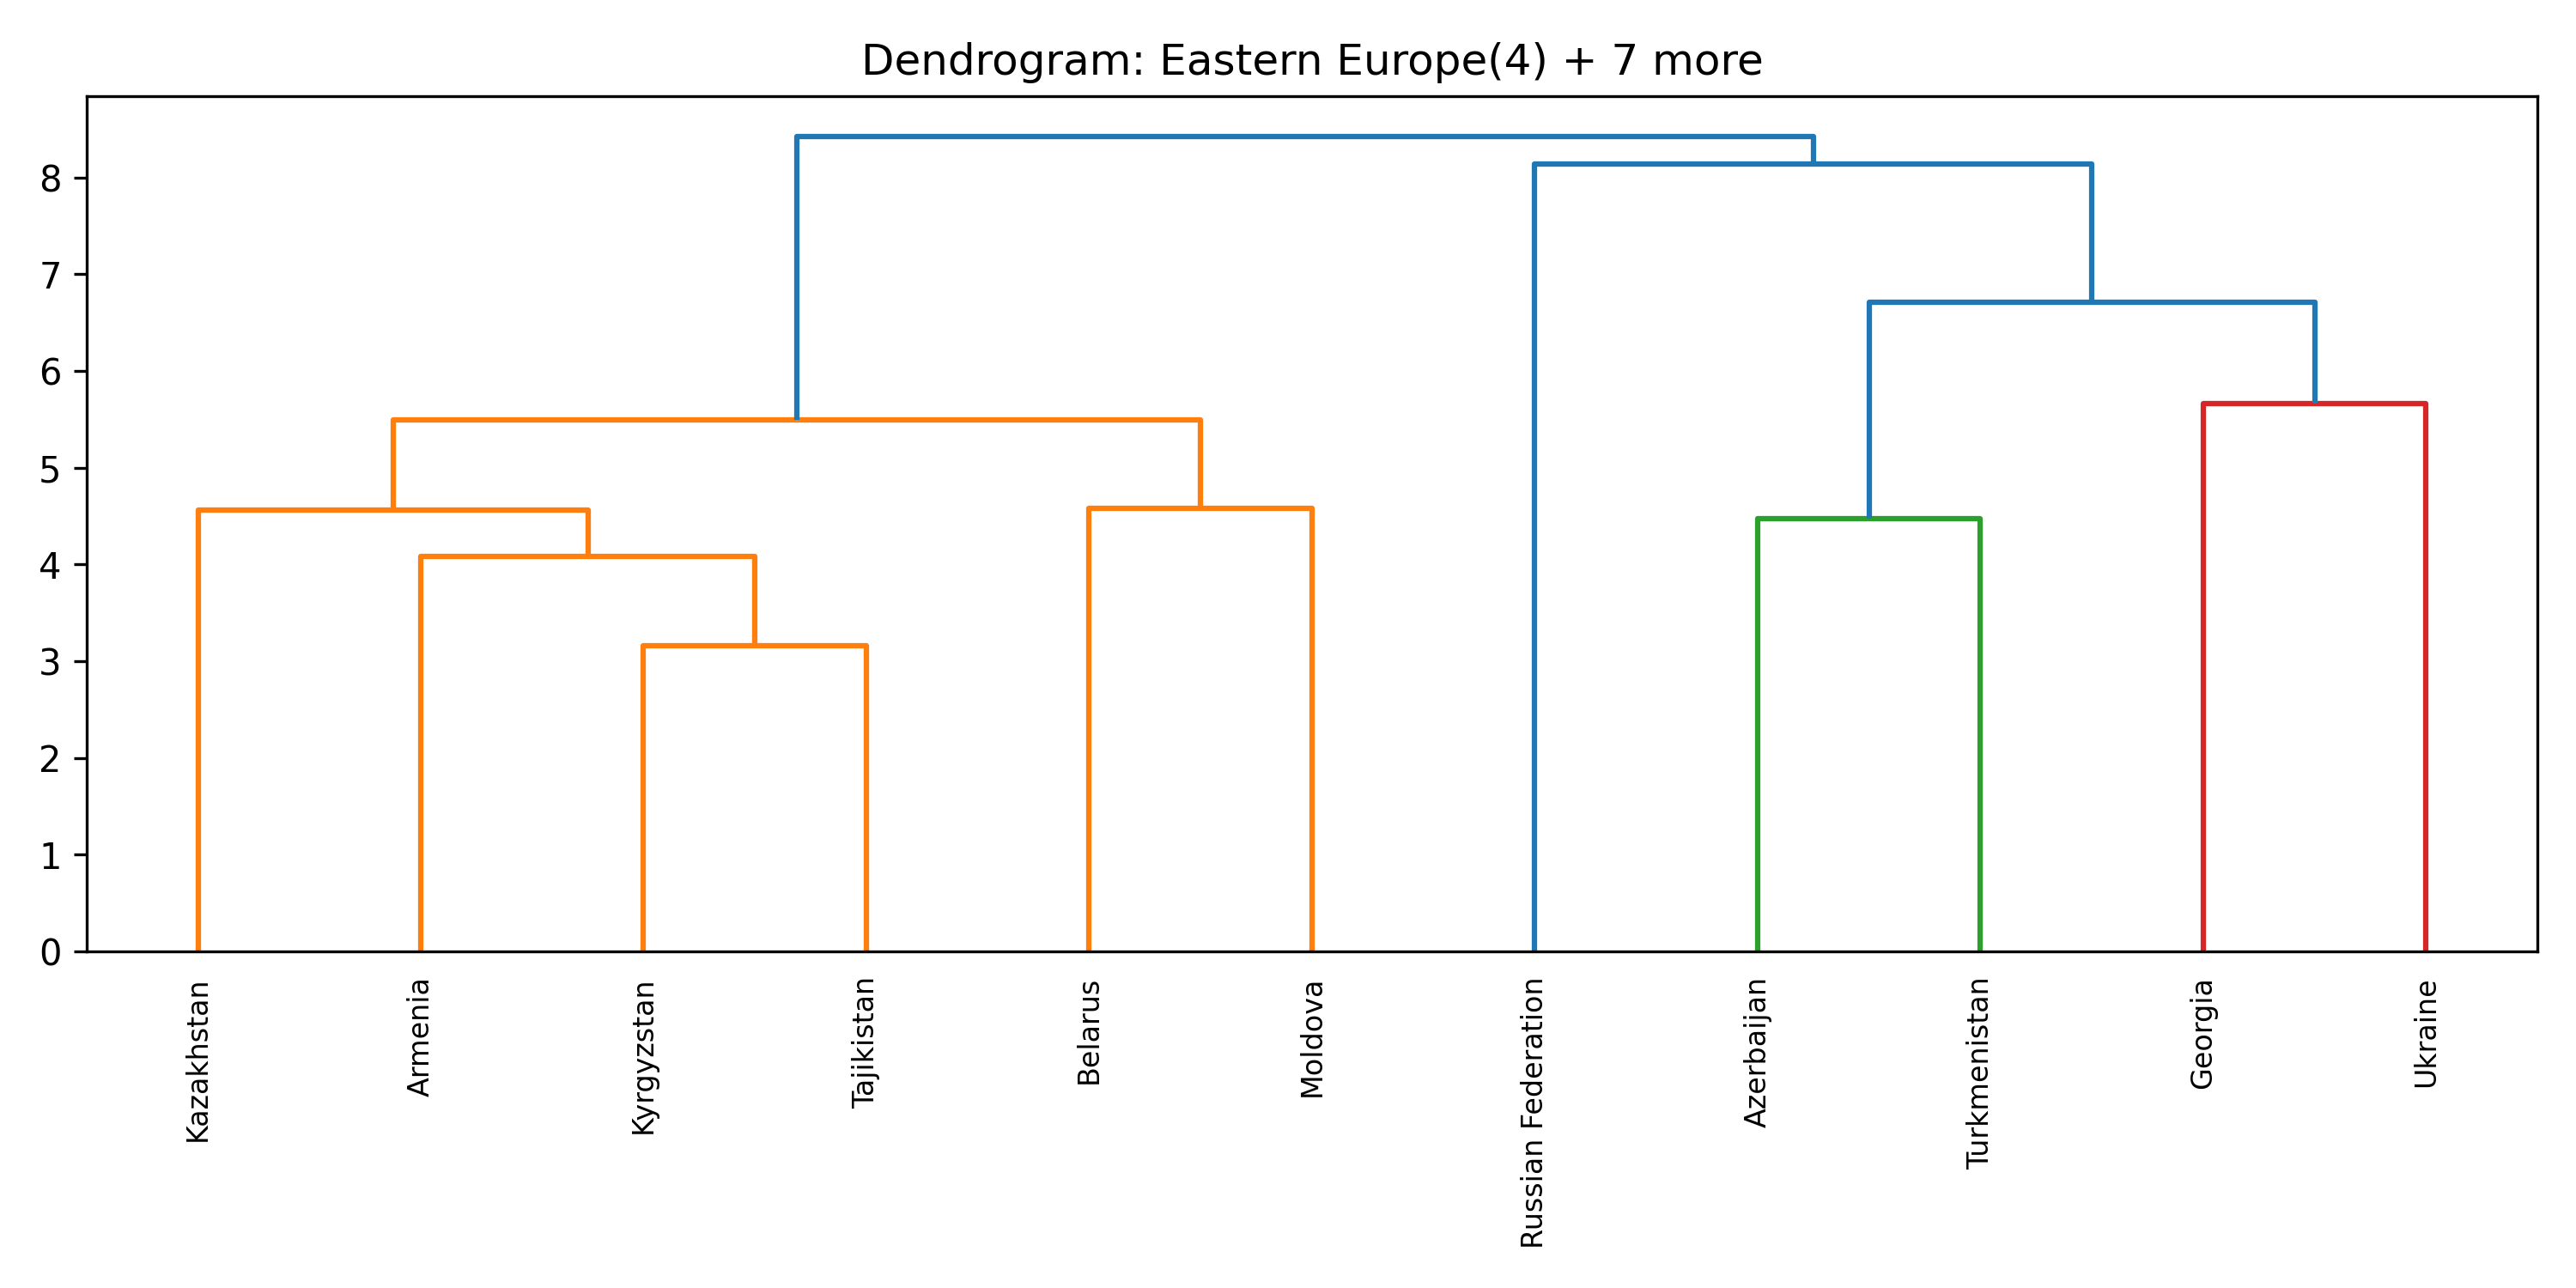
Before searching for tipping coalitions in the full 175-country dataset, we use hierarchical clustering to group countries by how similar their treaty ratification profiles are. Countries that have consistently signed the same agreements belong to the same treaty community.
This gives us eight clusters, each named by its dominant geographic subregion. These clusters serve a crucial role: a coalition that spans many clusters exerts influence through many independent channels, making it harder for other parties to ignore.
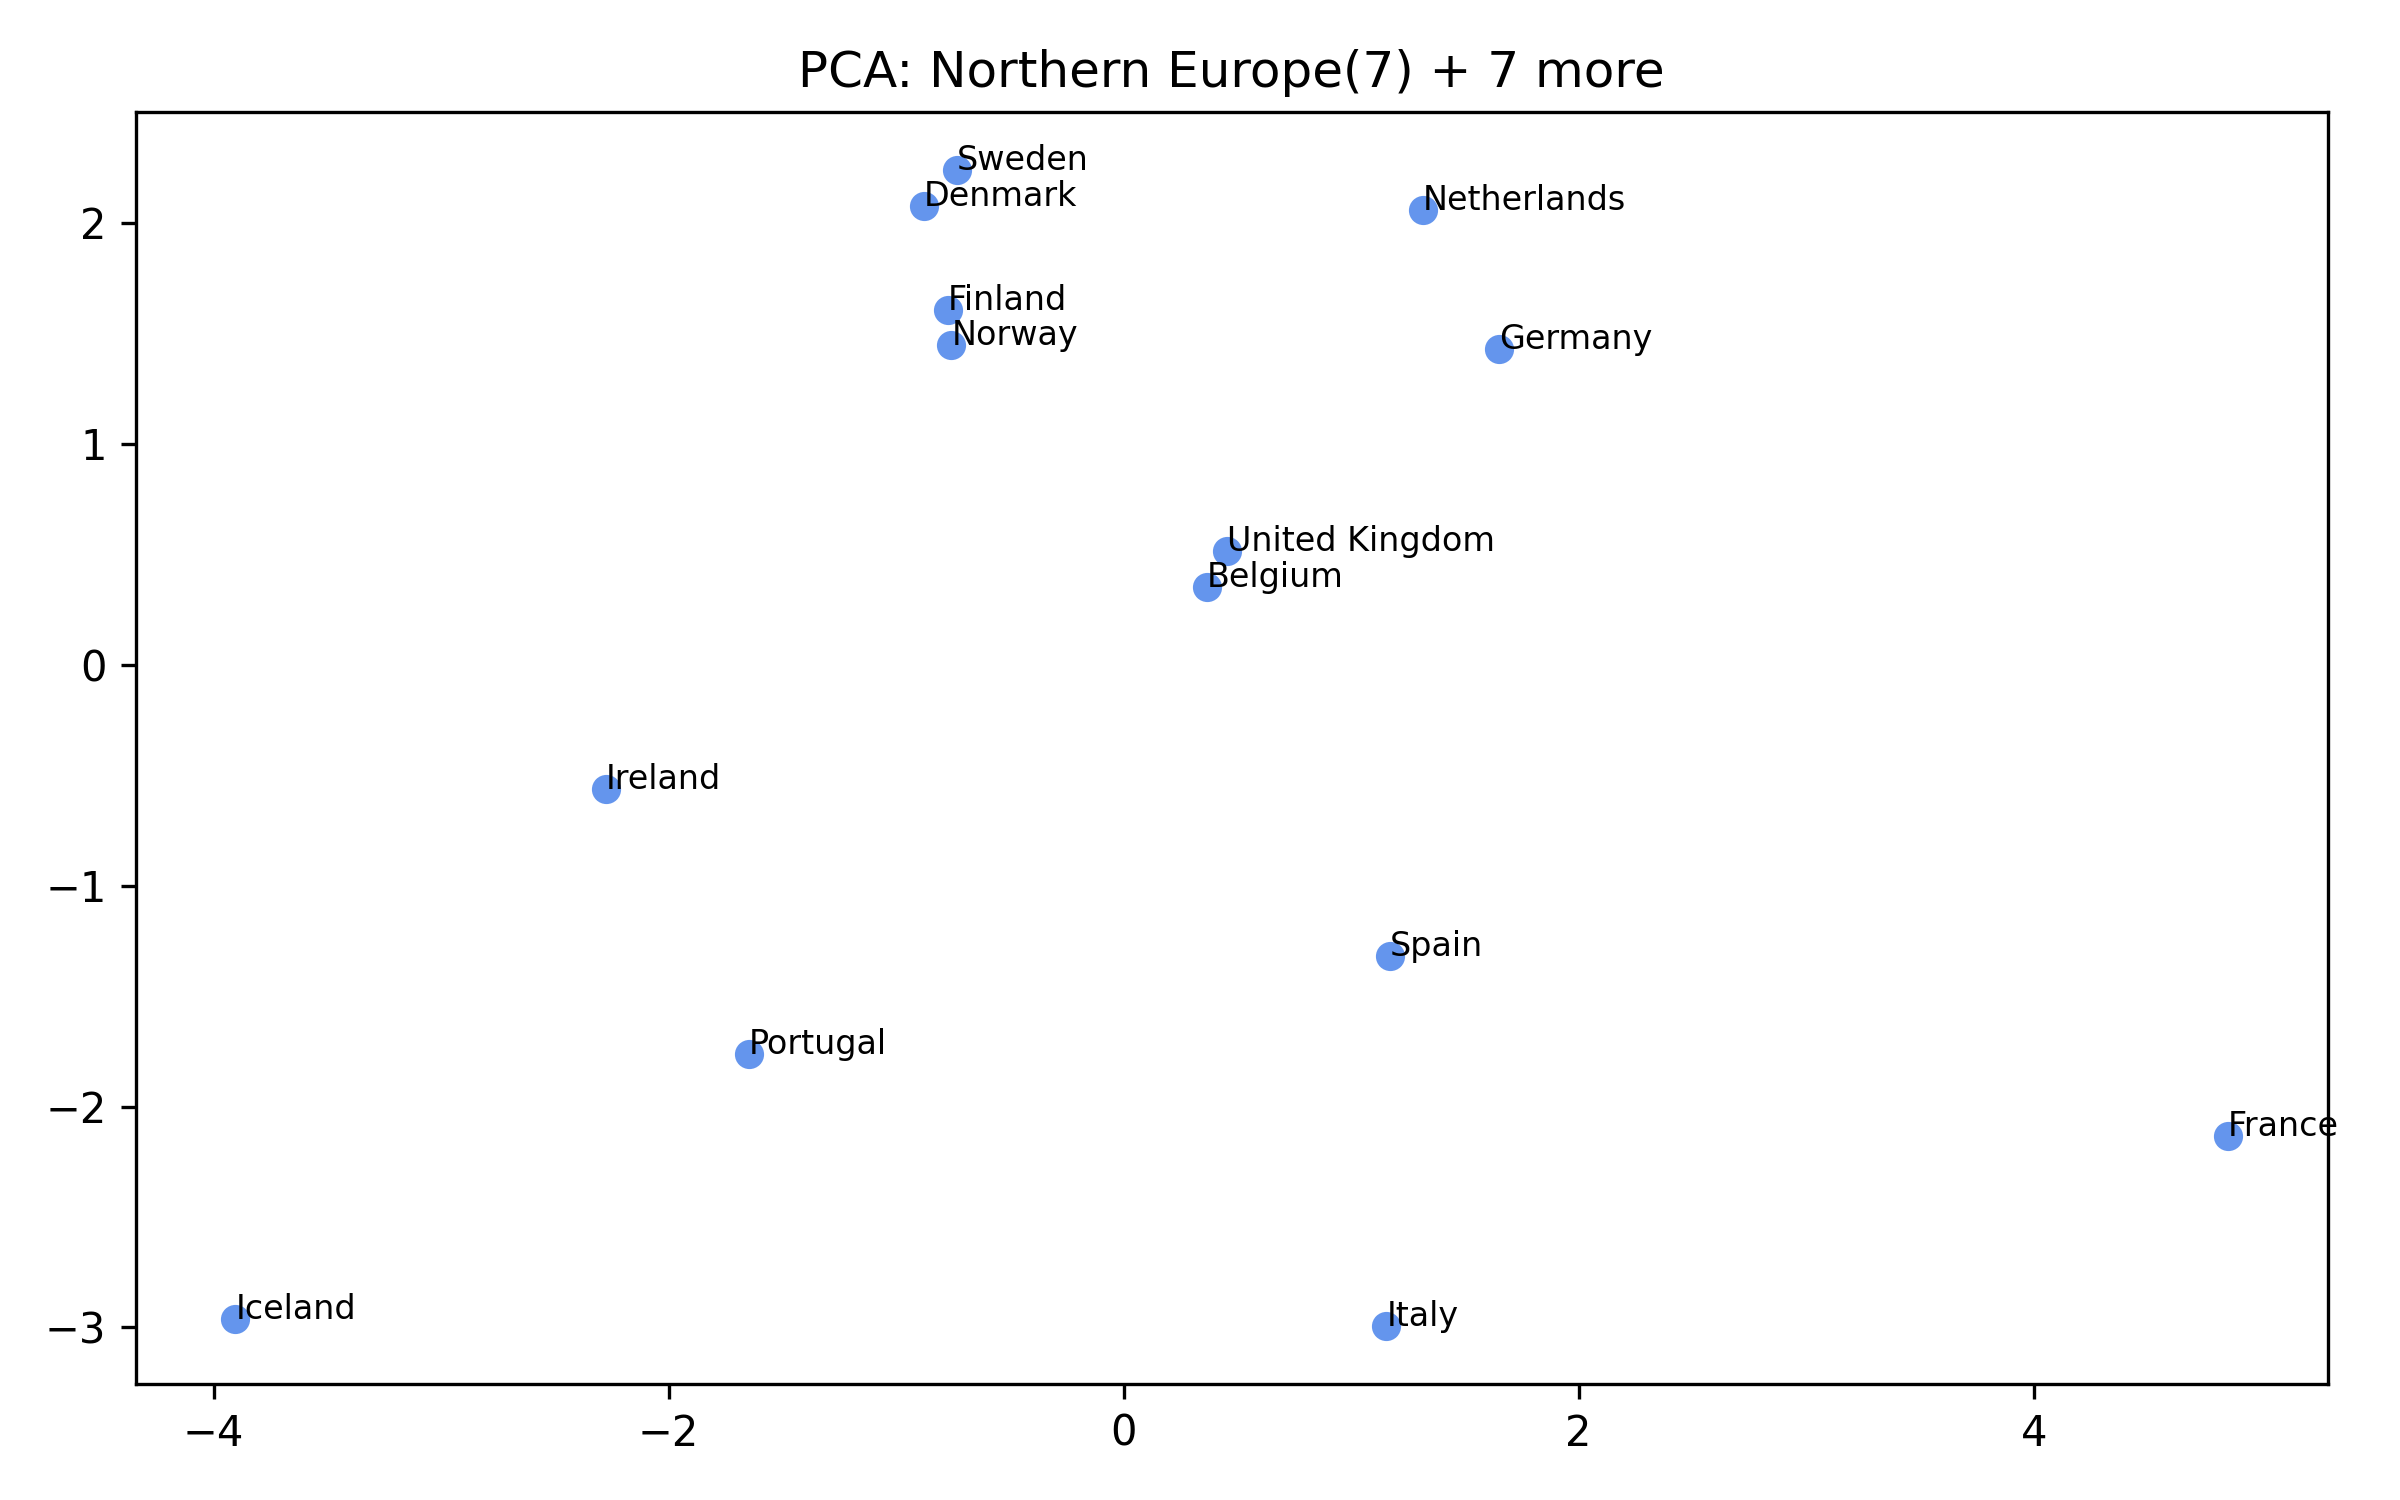
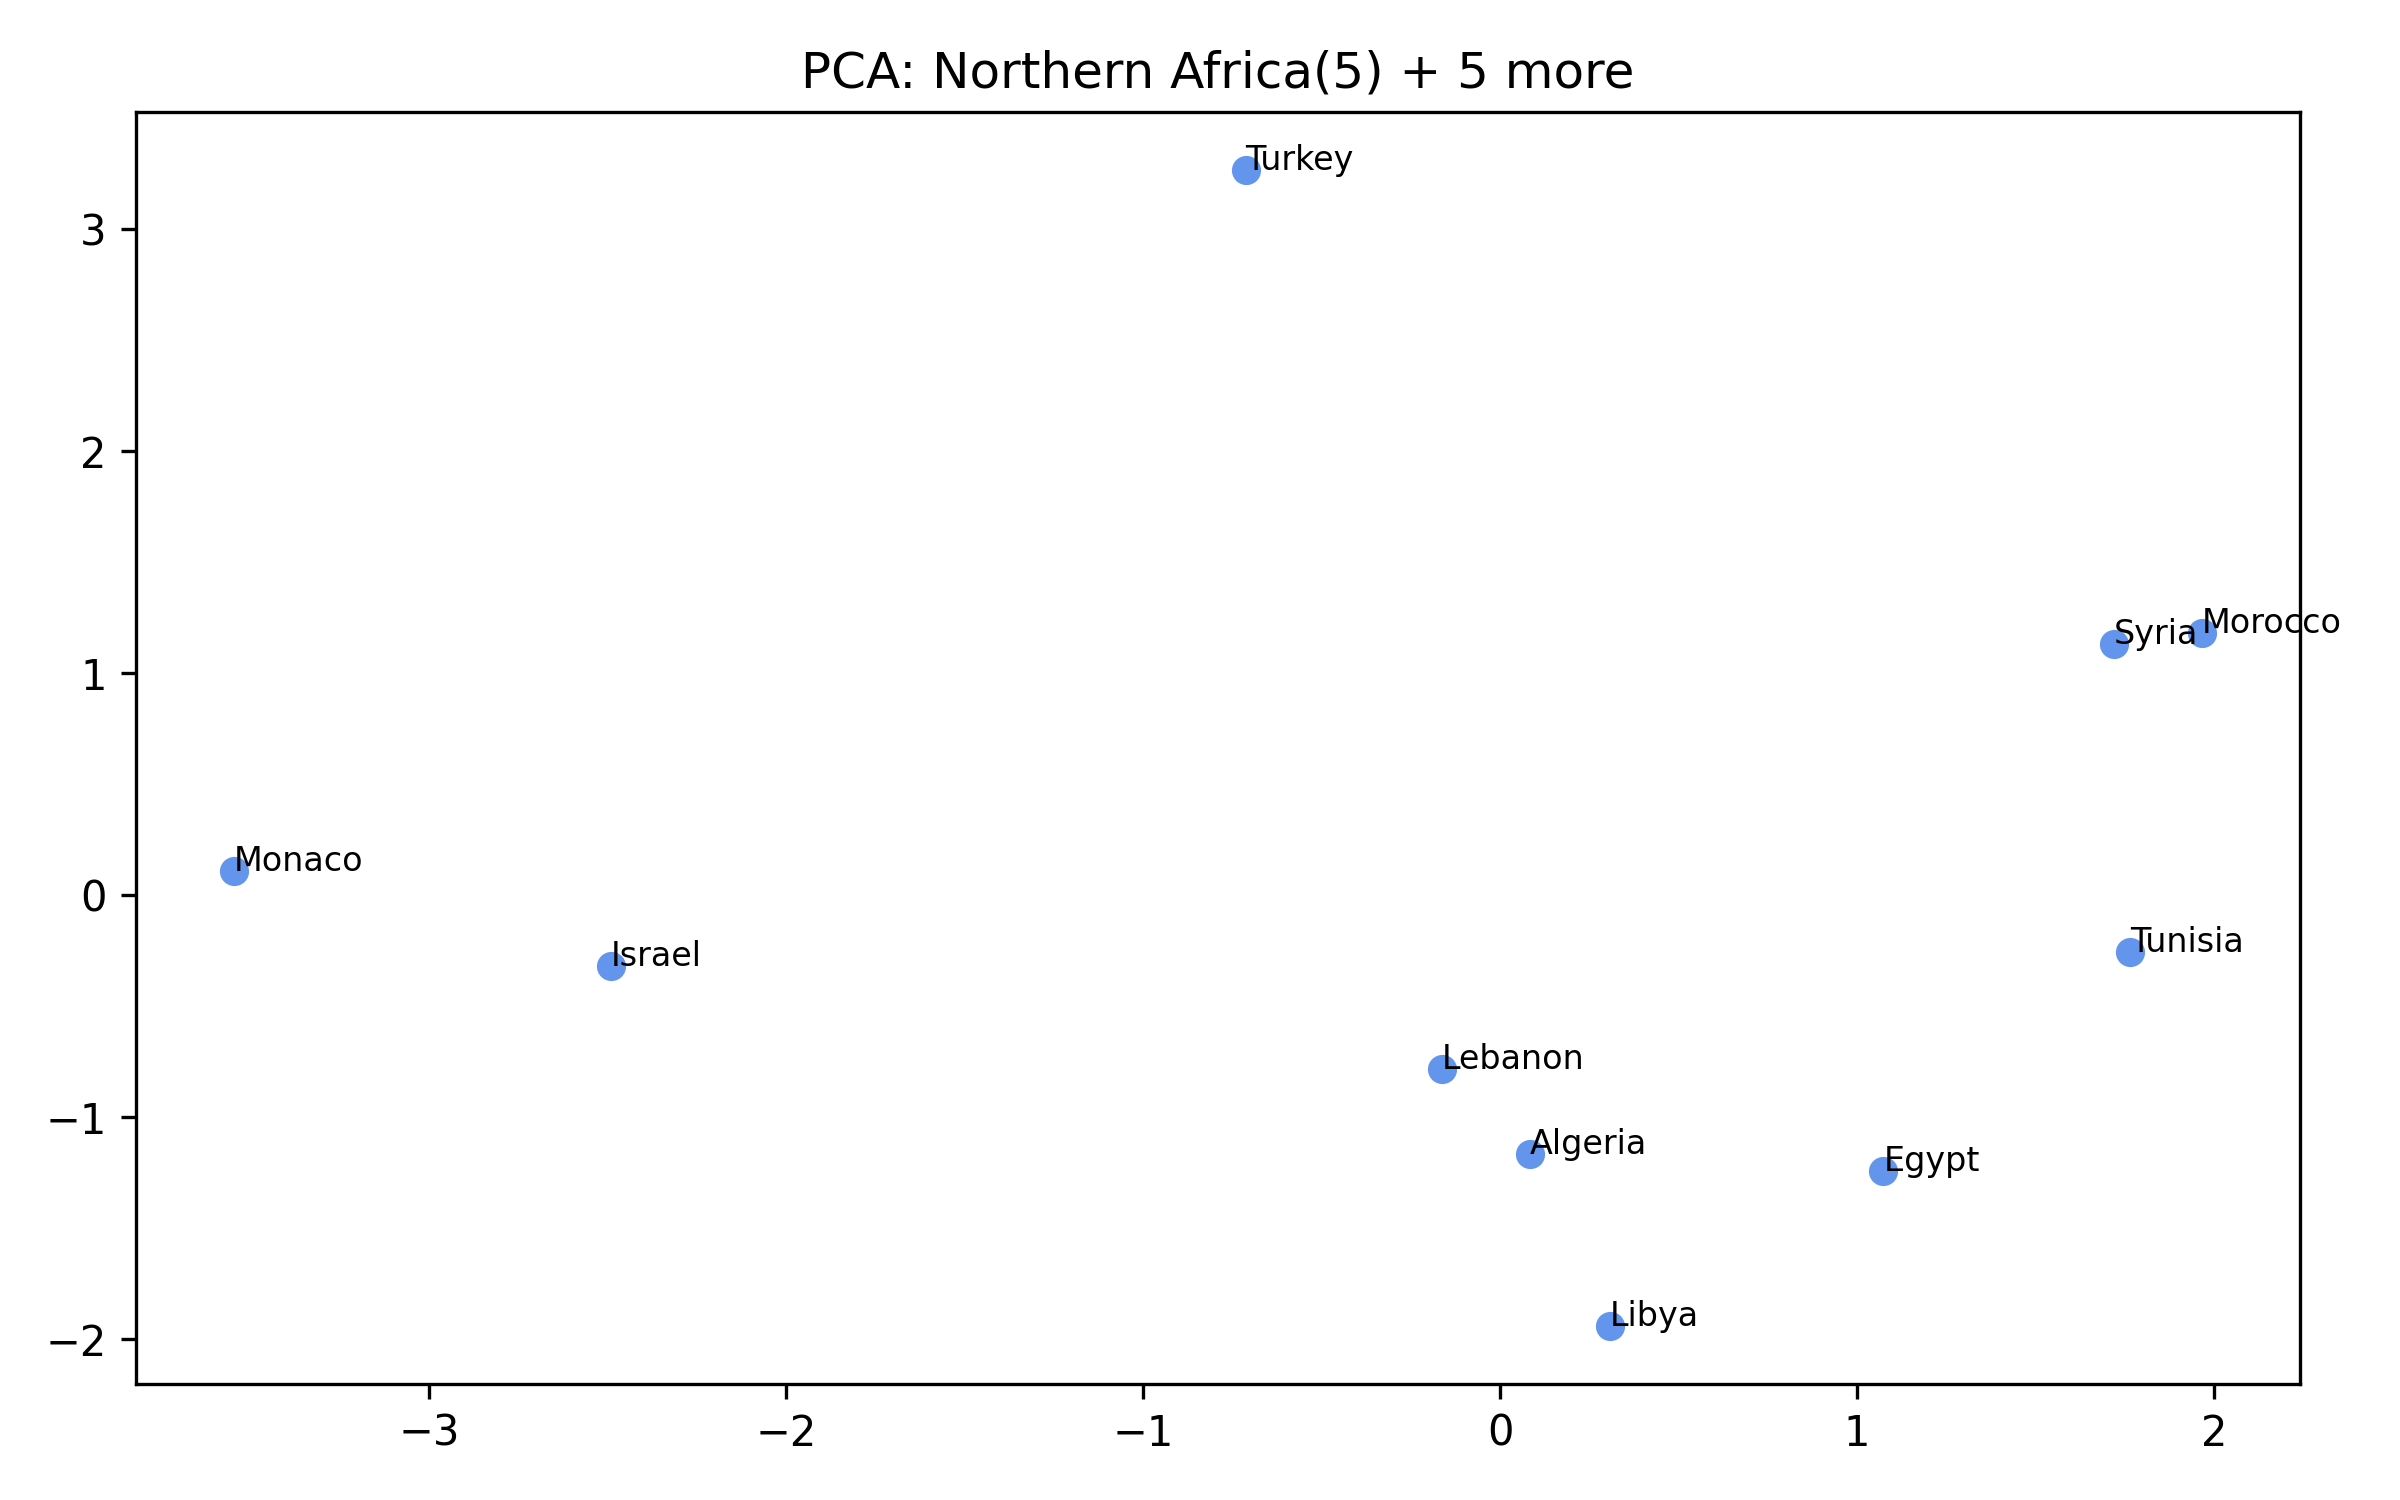
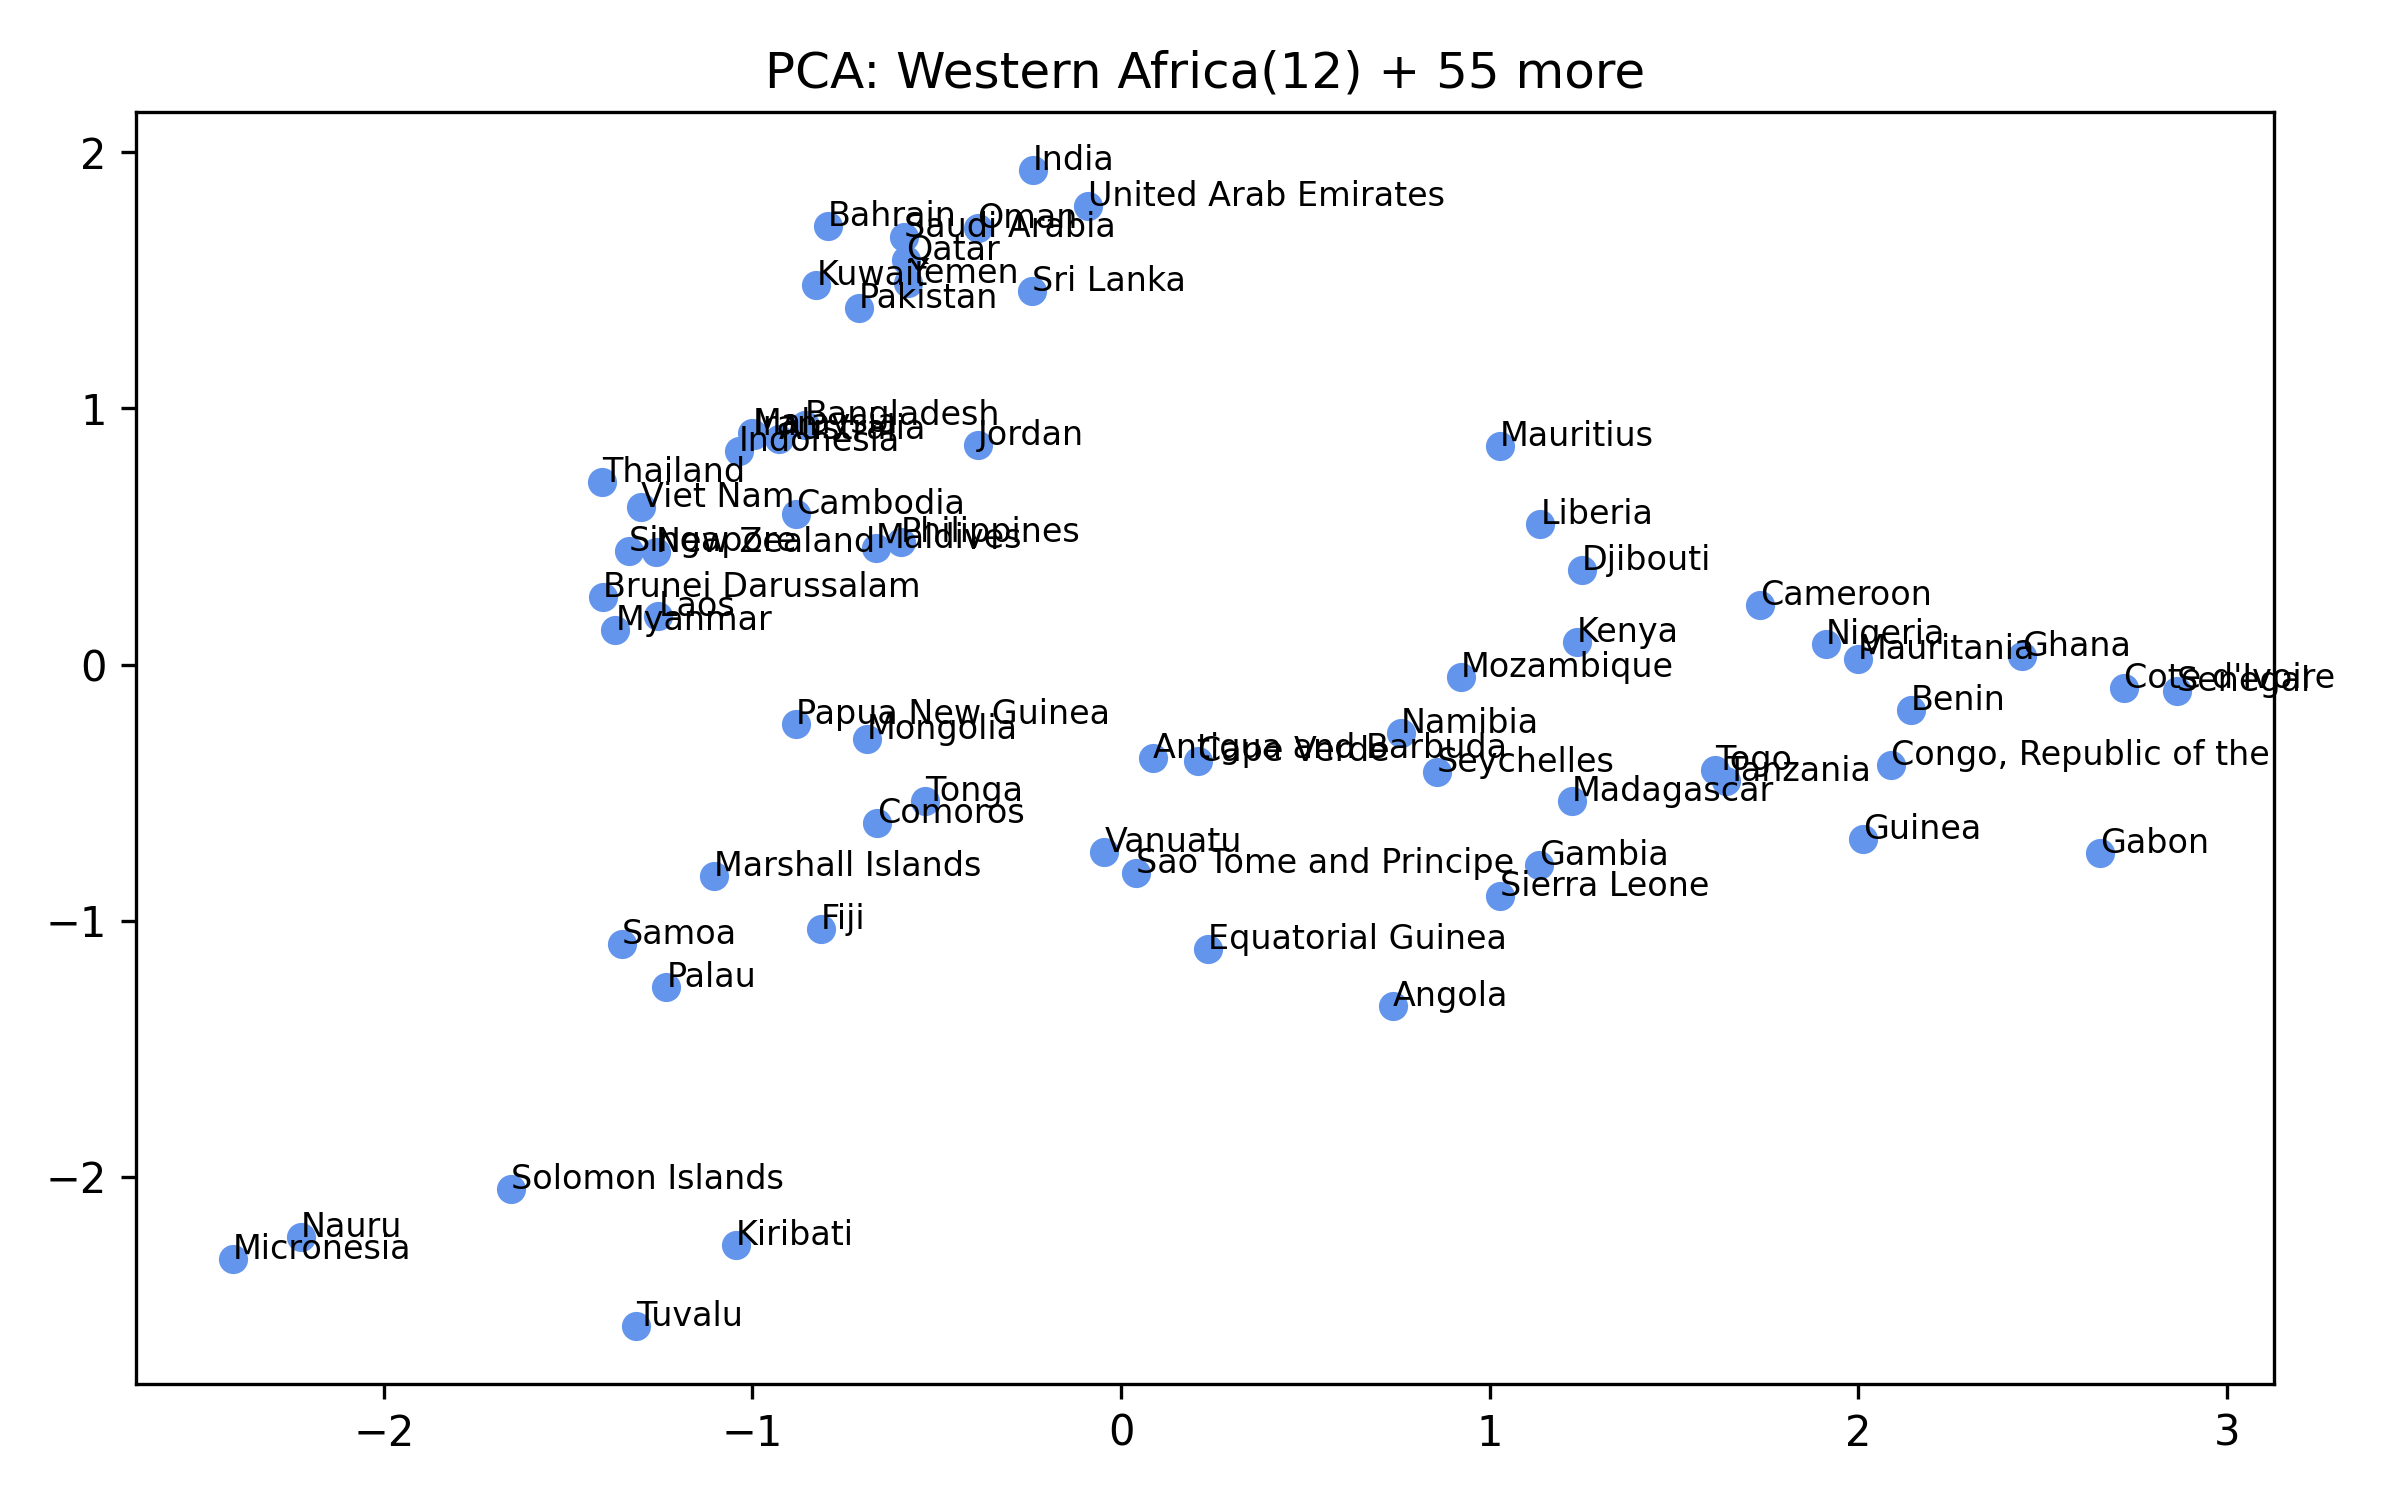
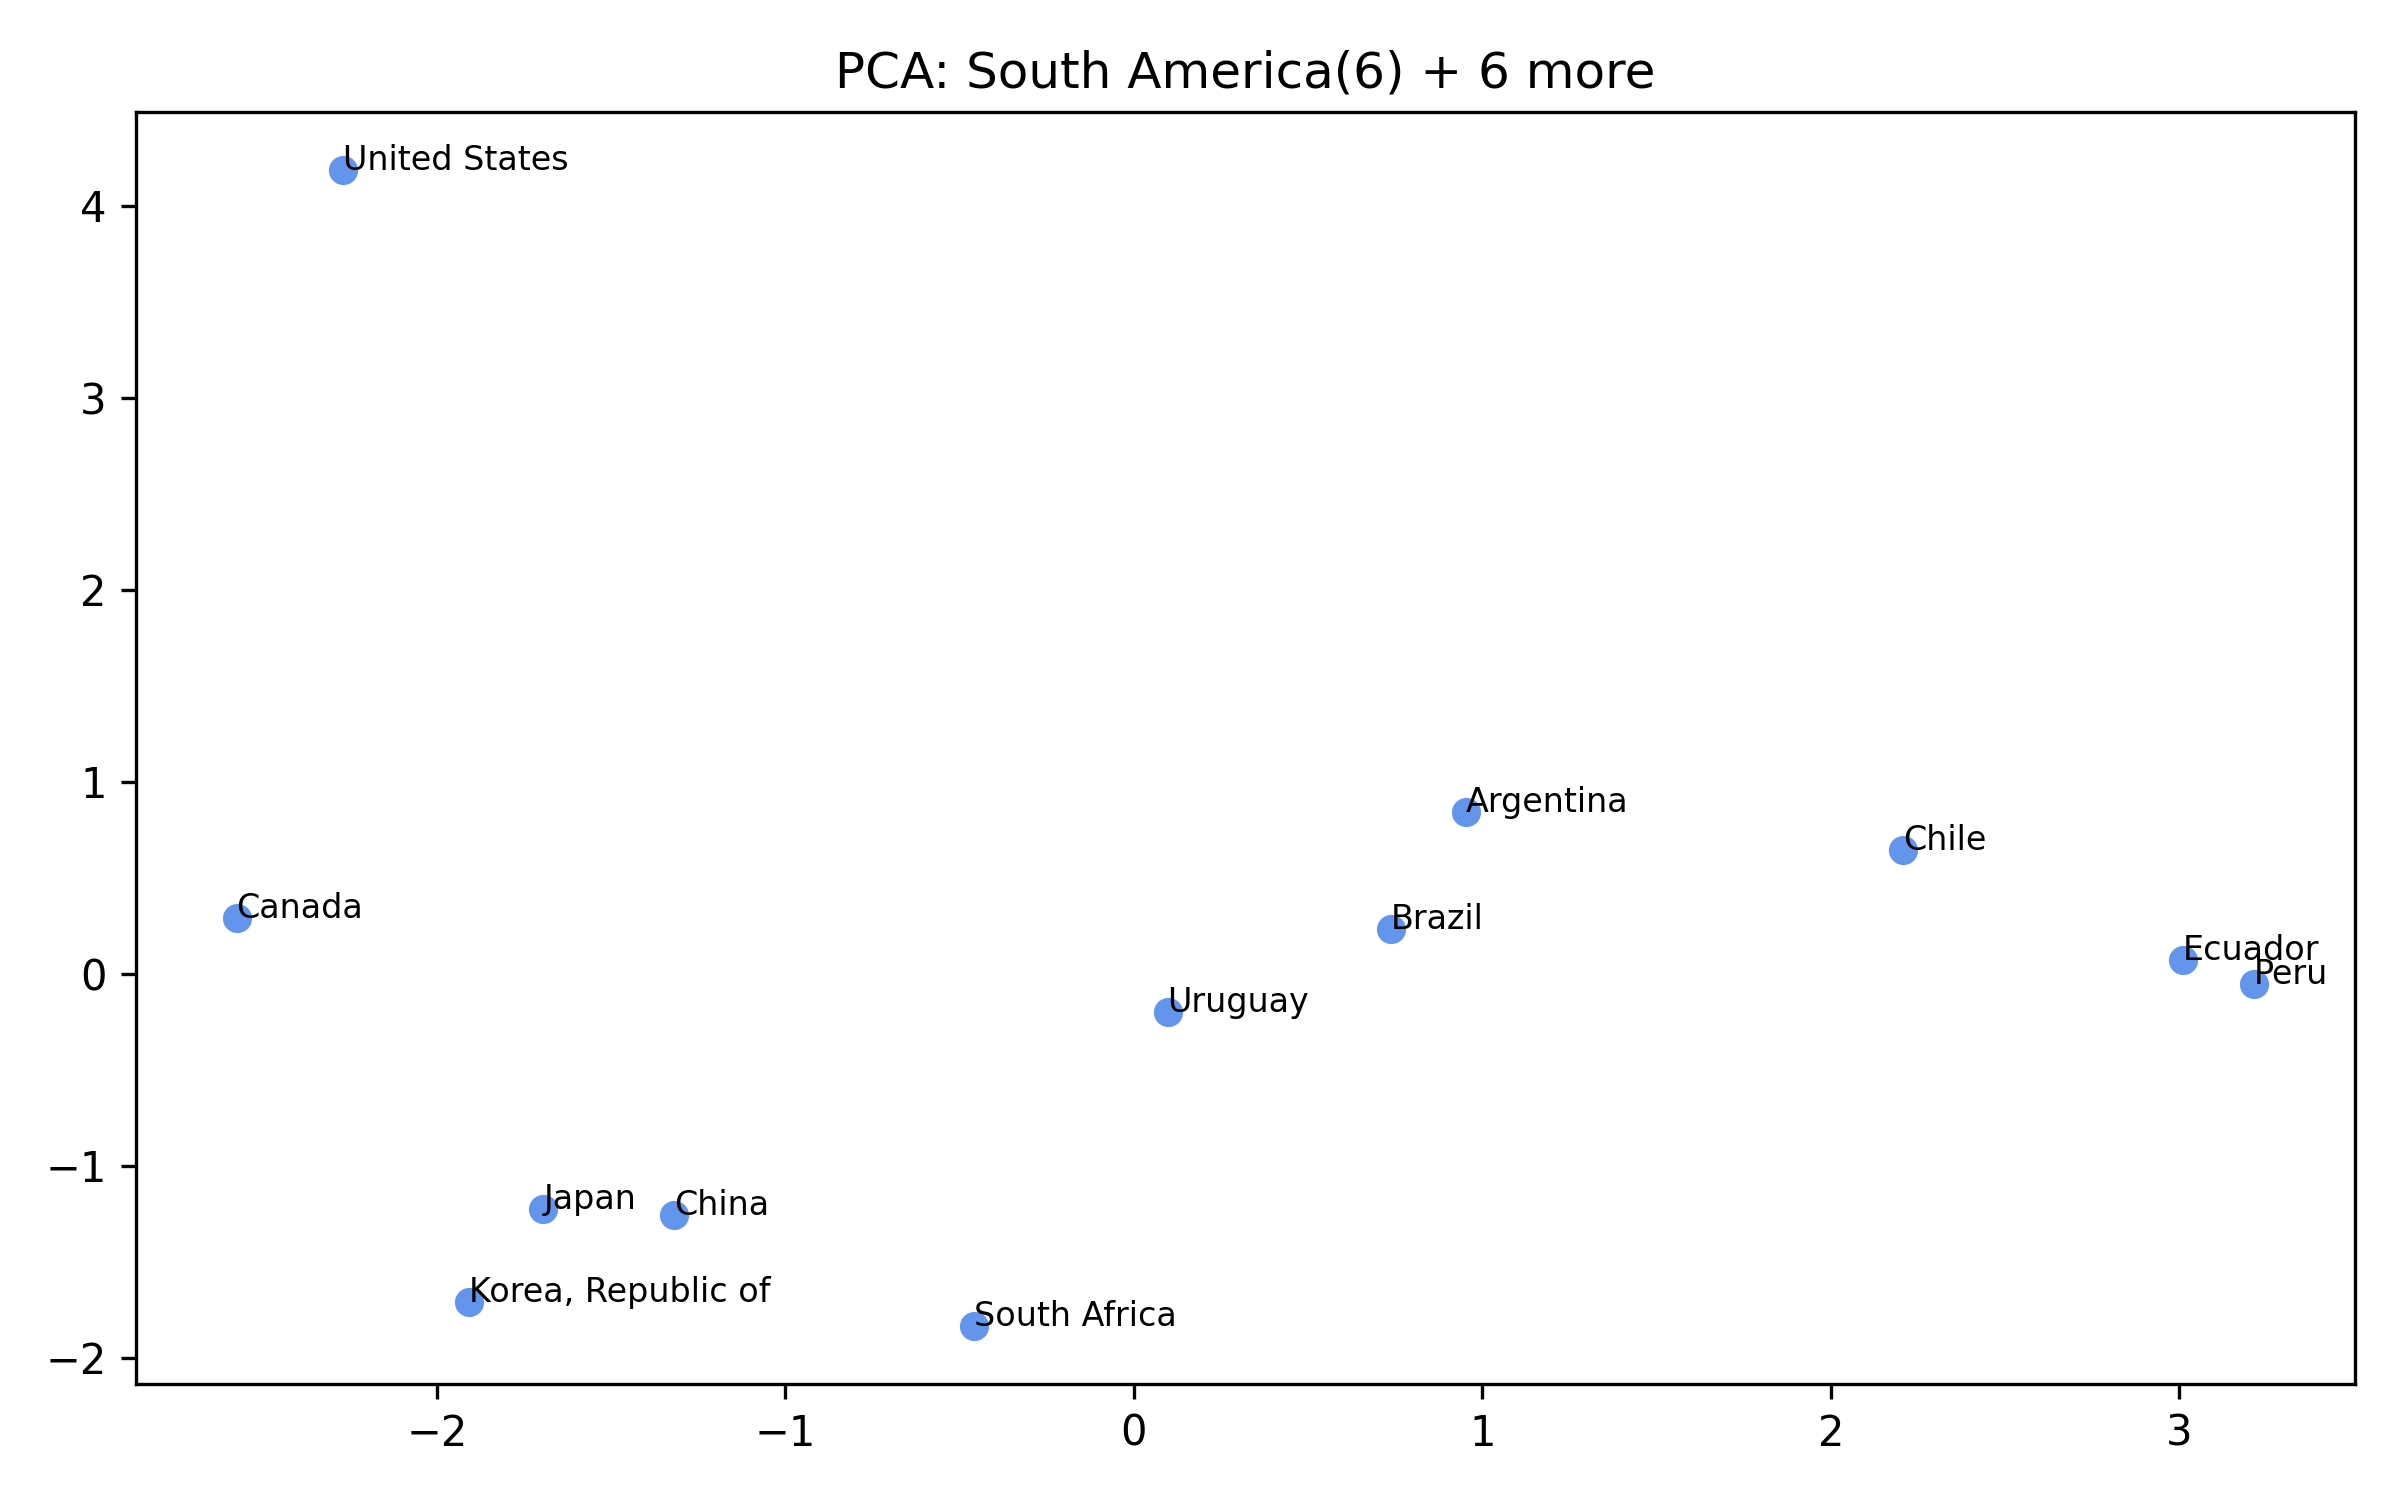
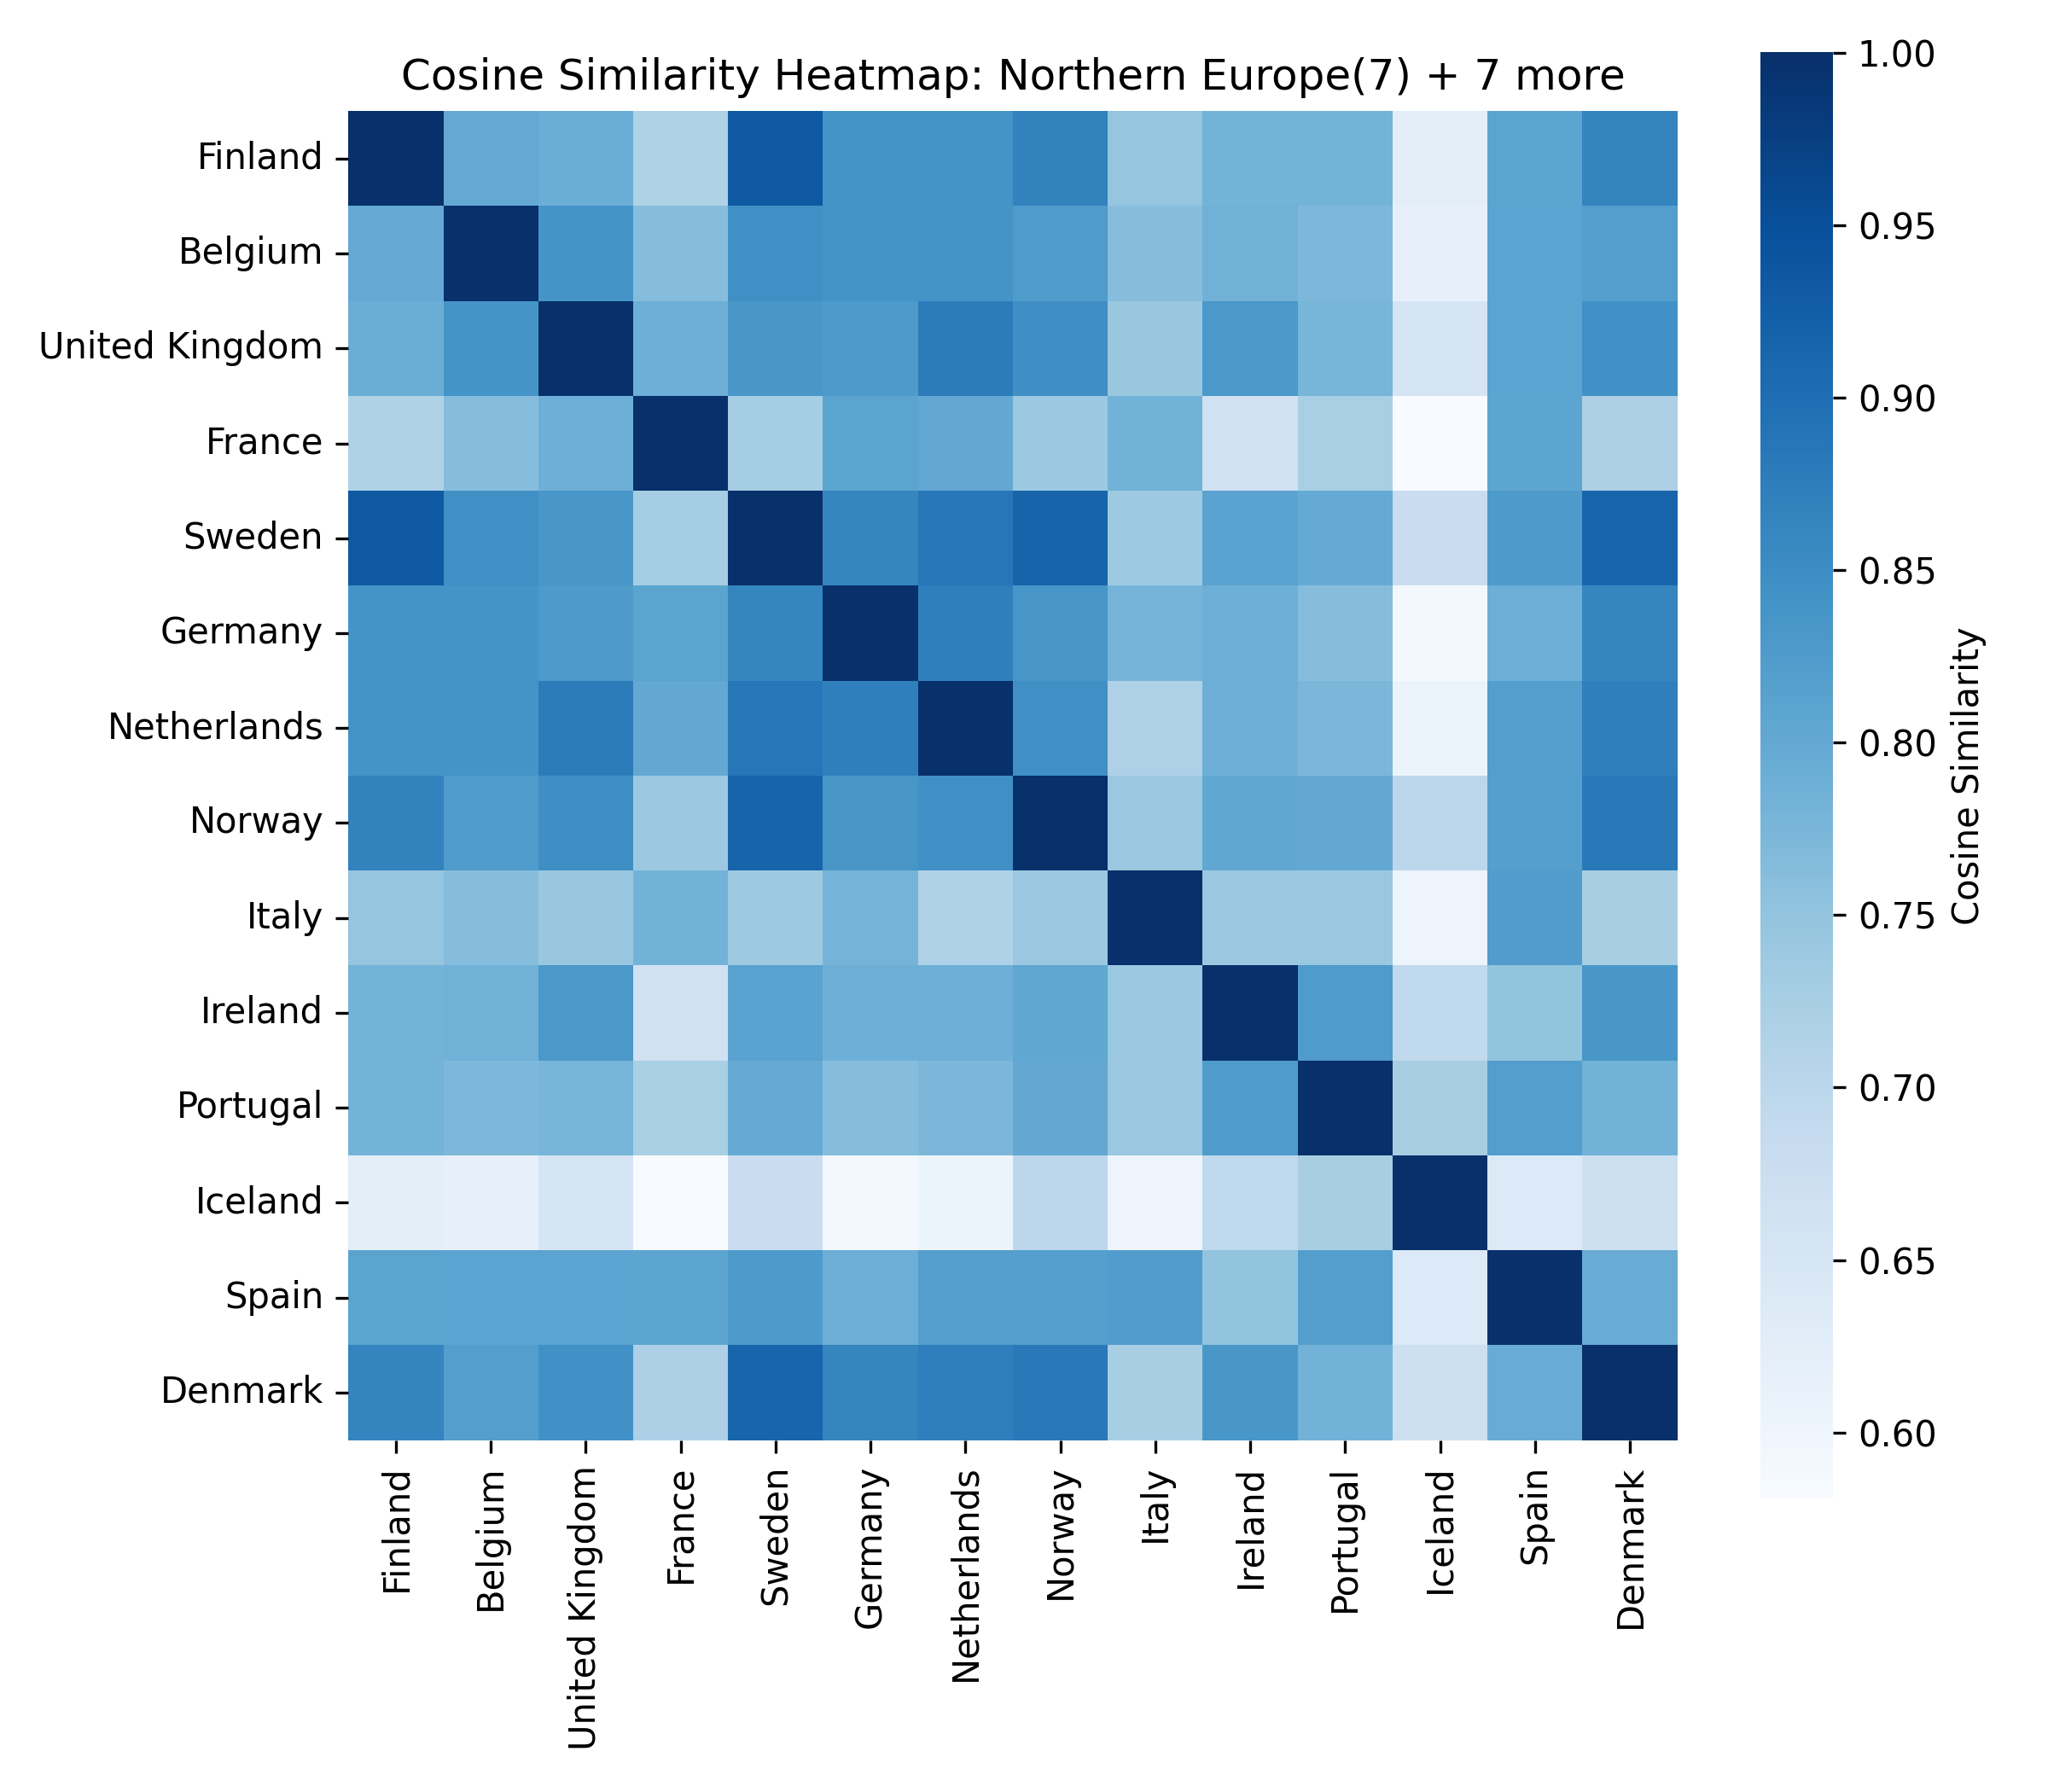
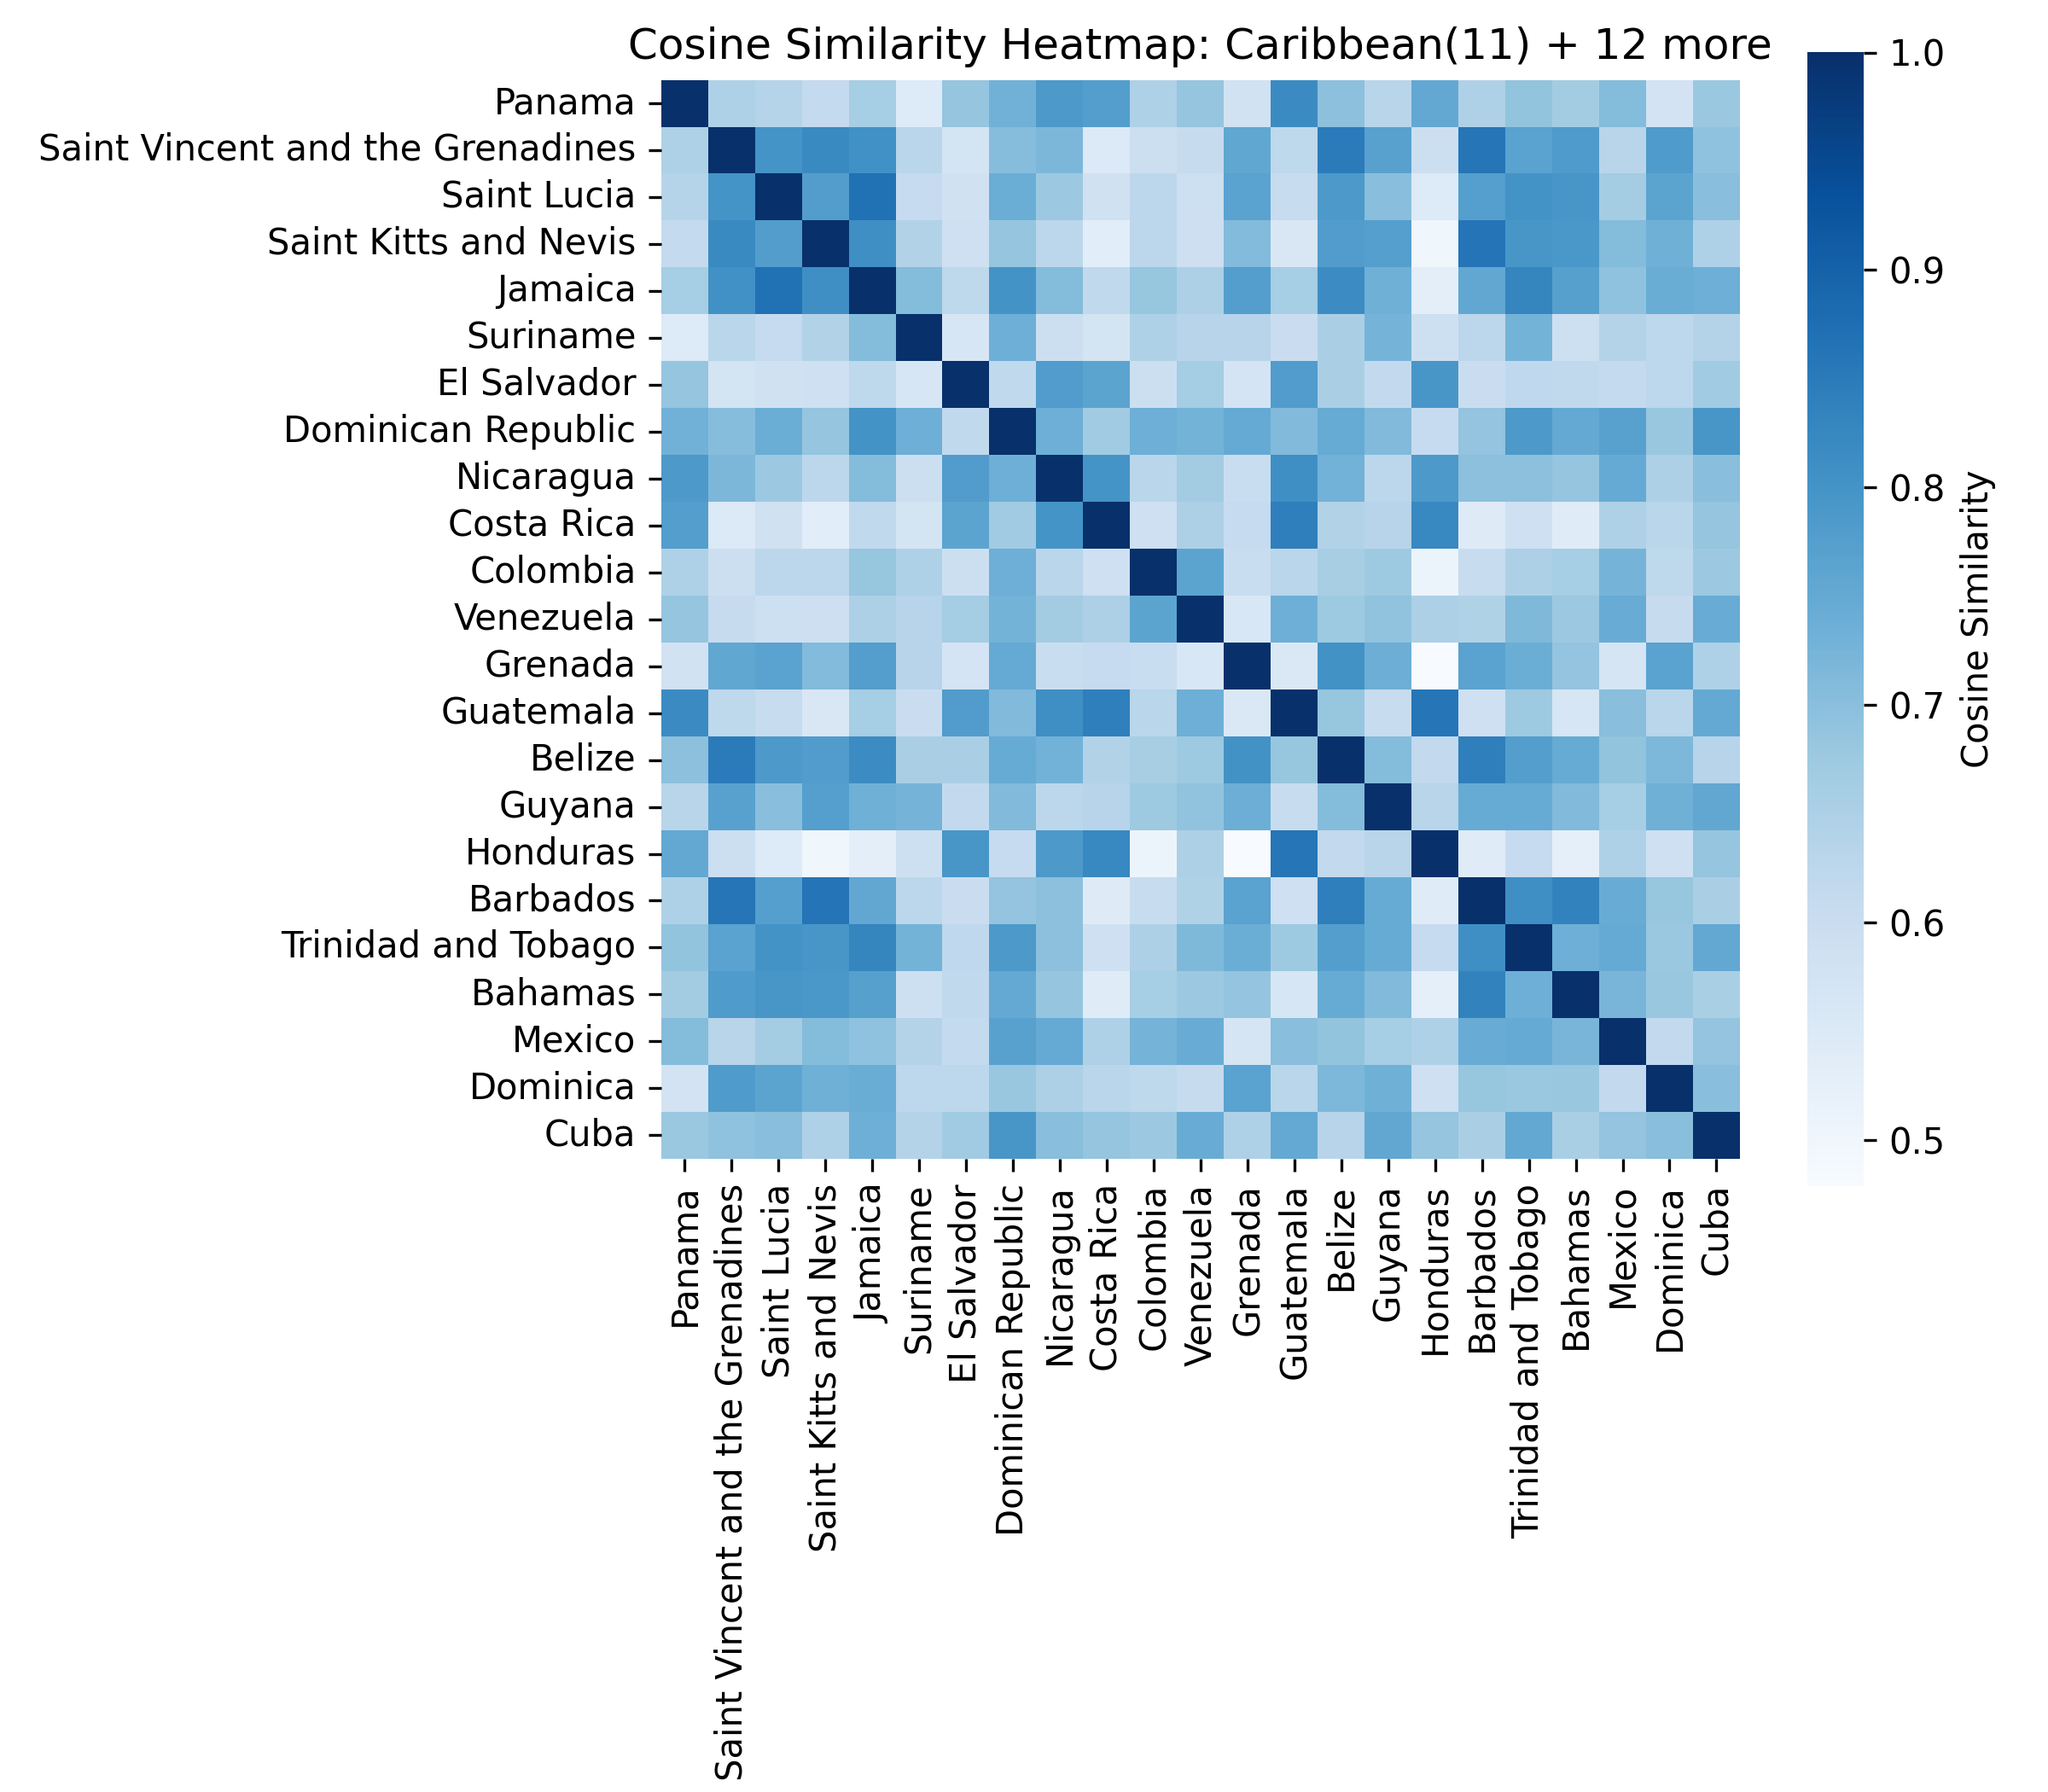
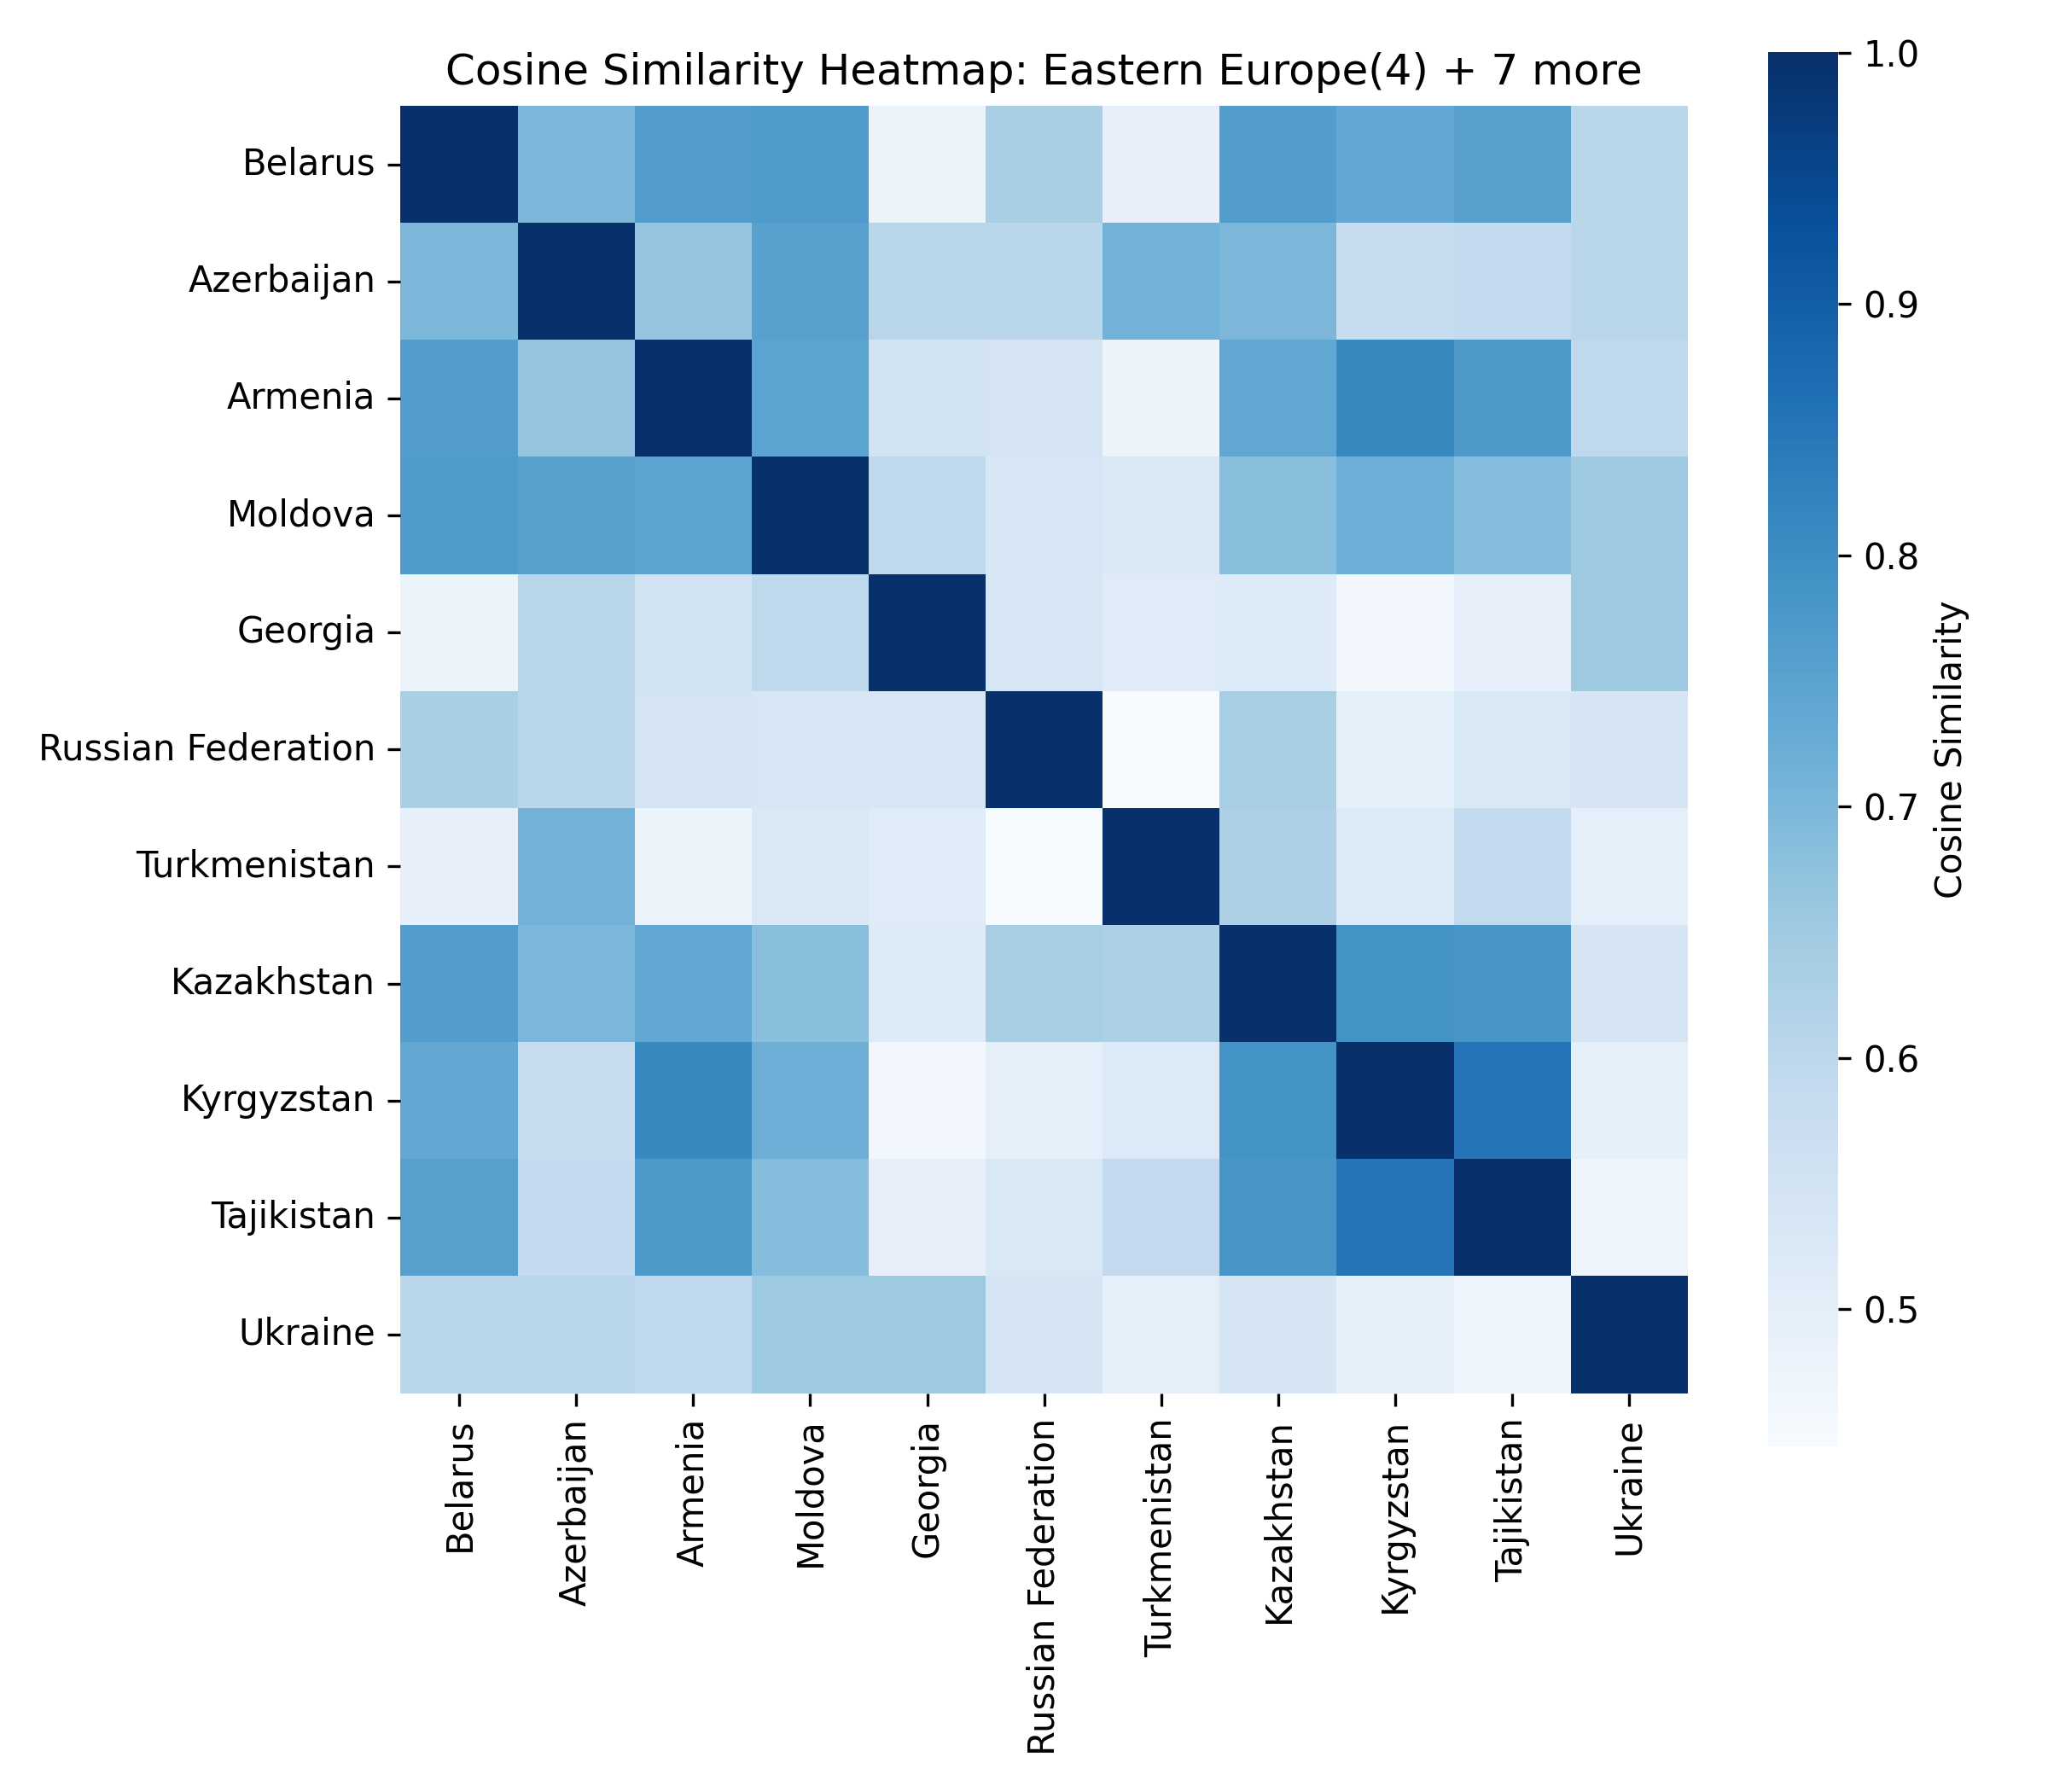
Inside each cluster
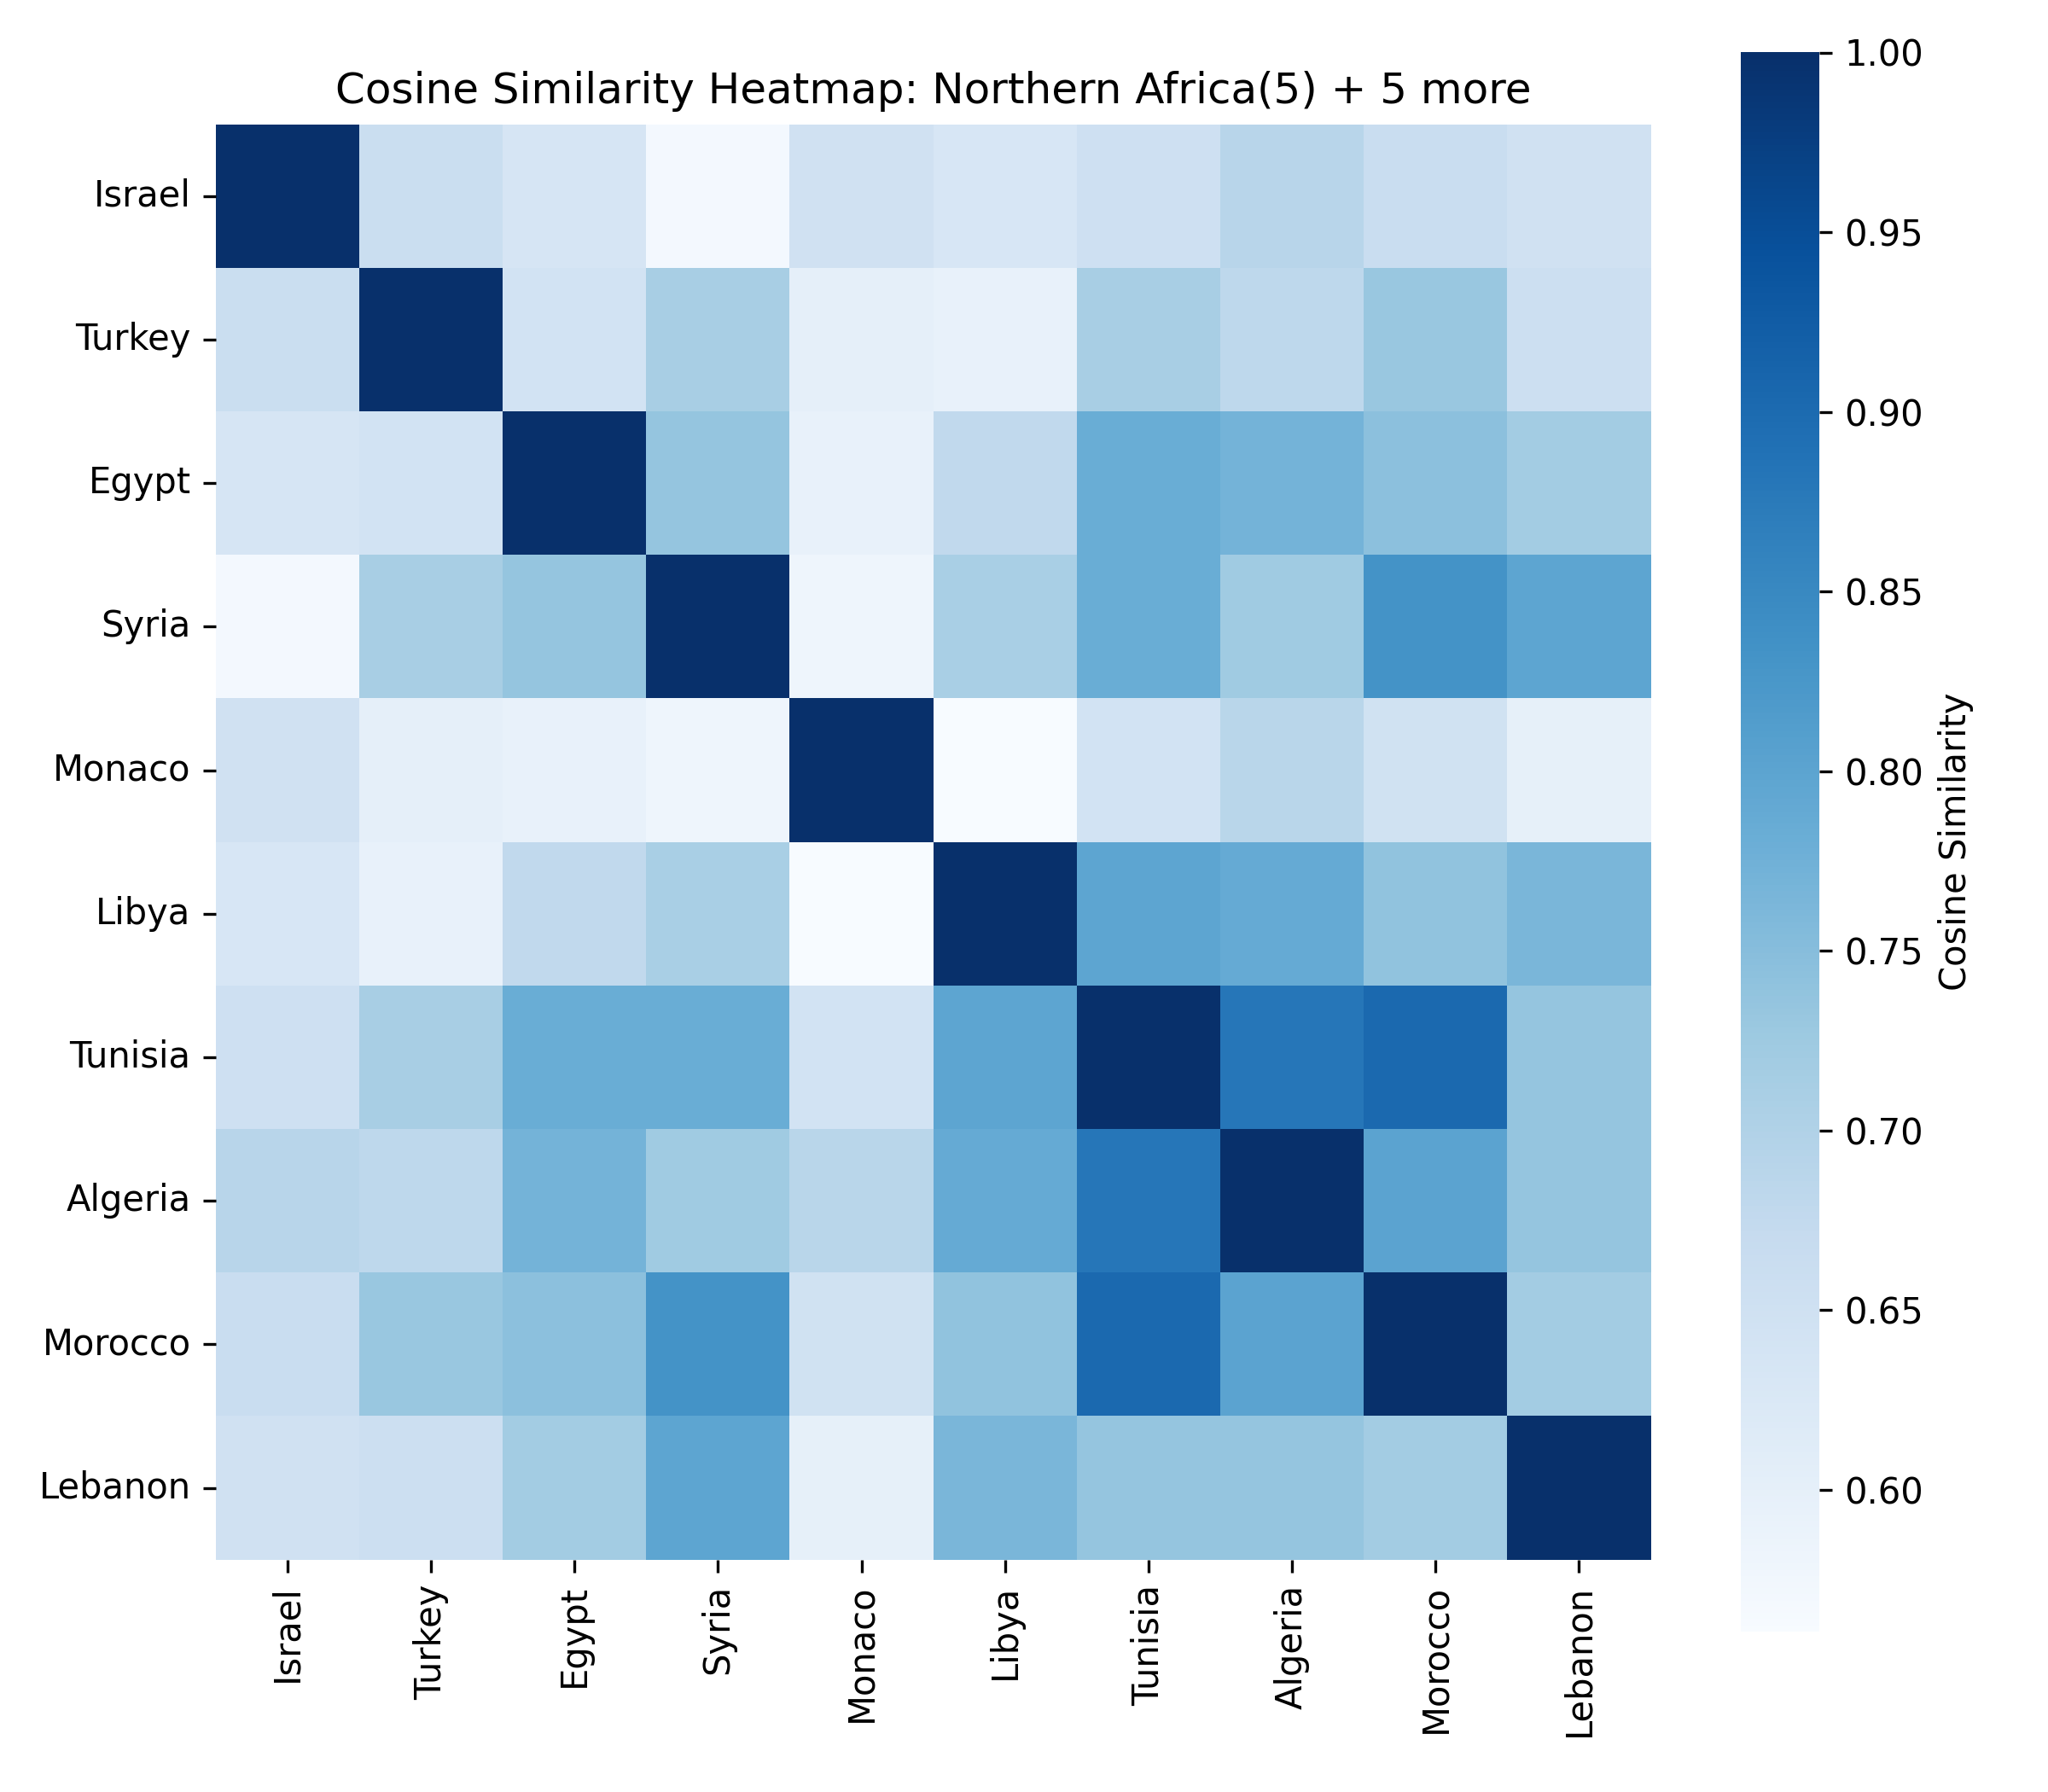
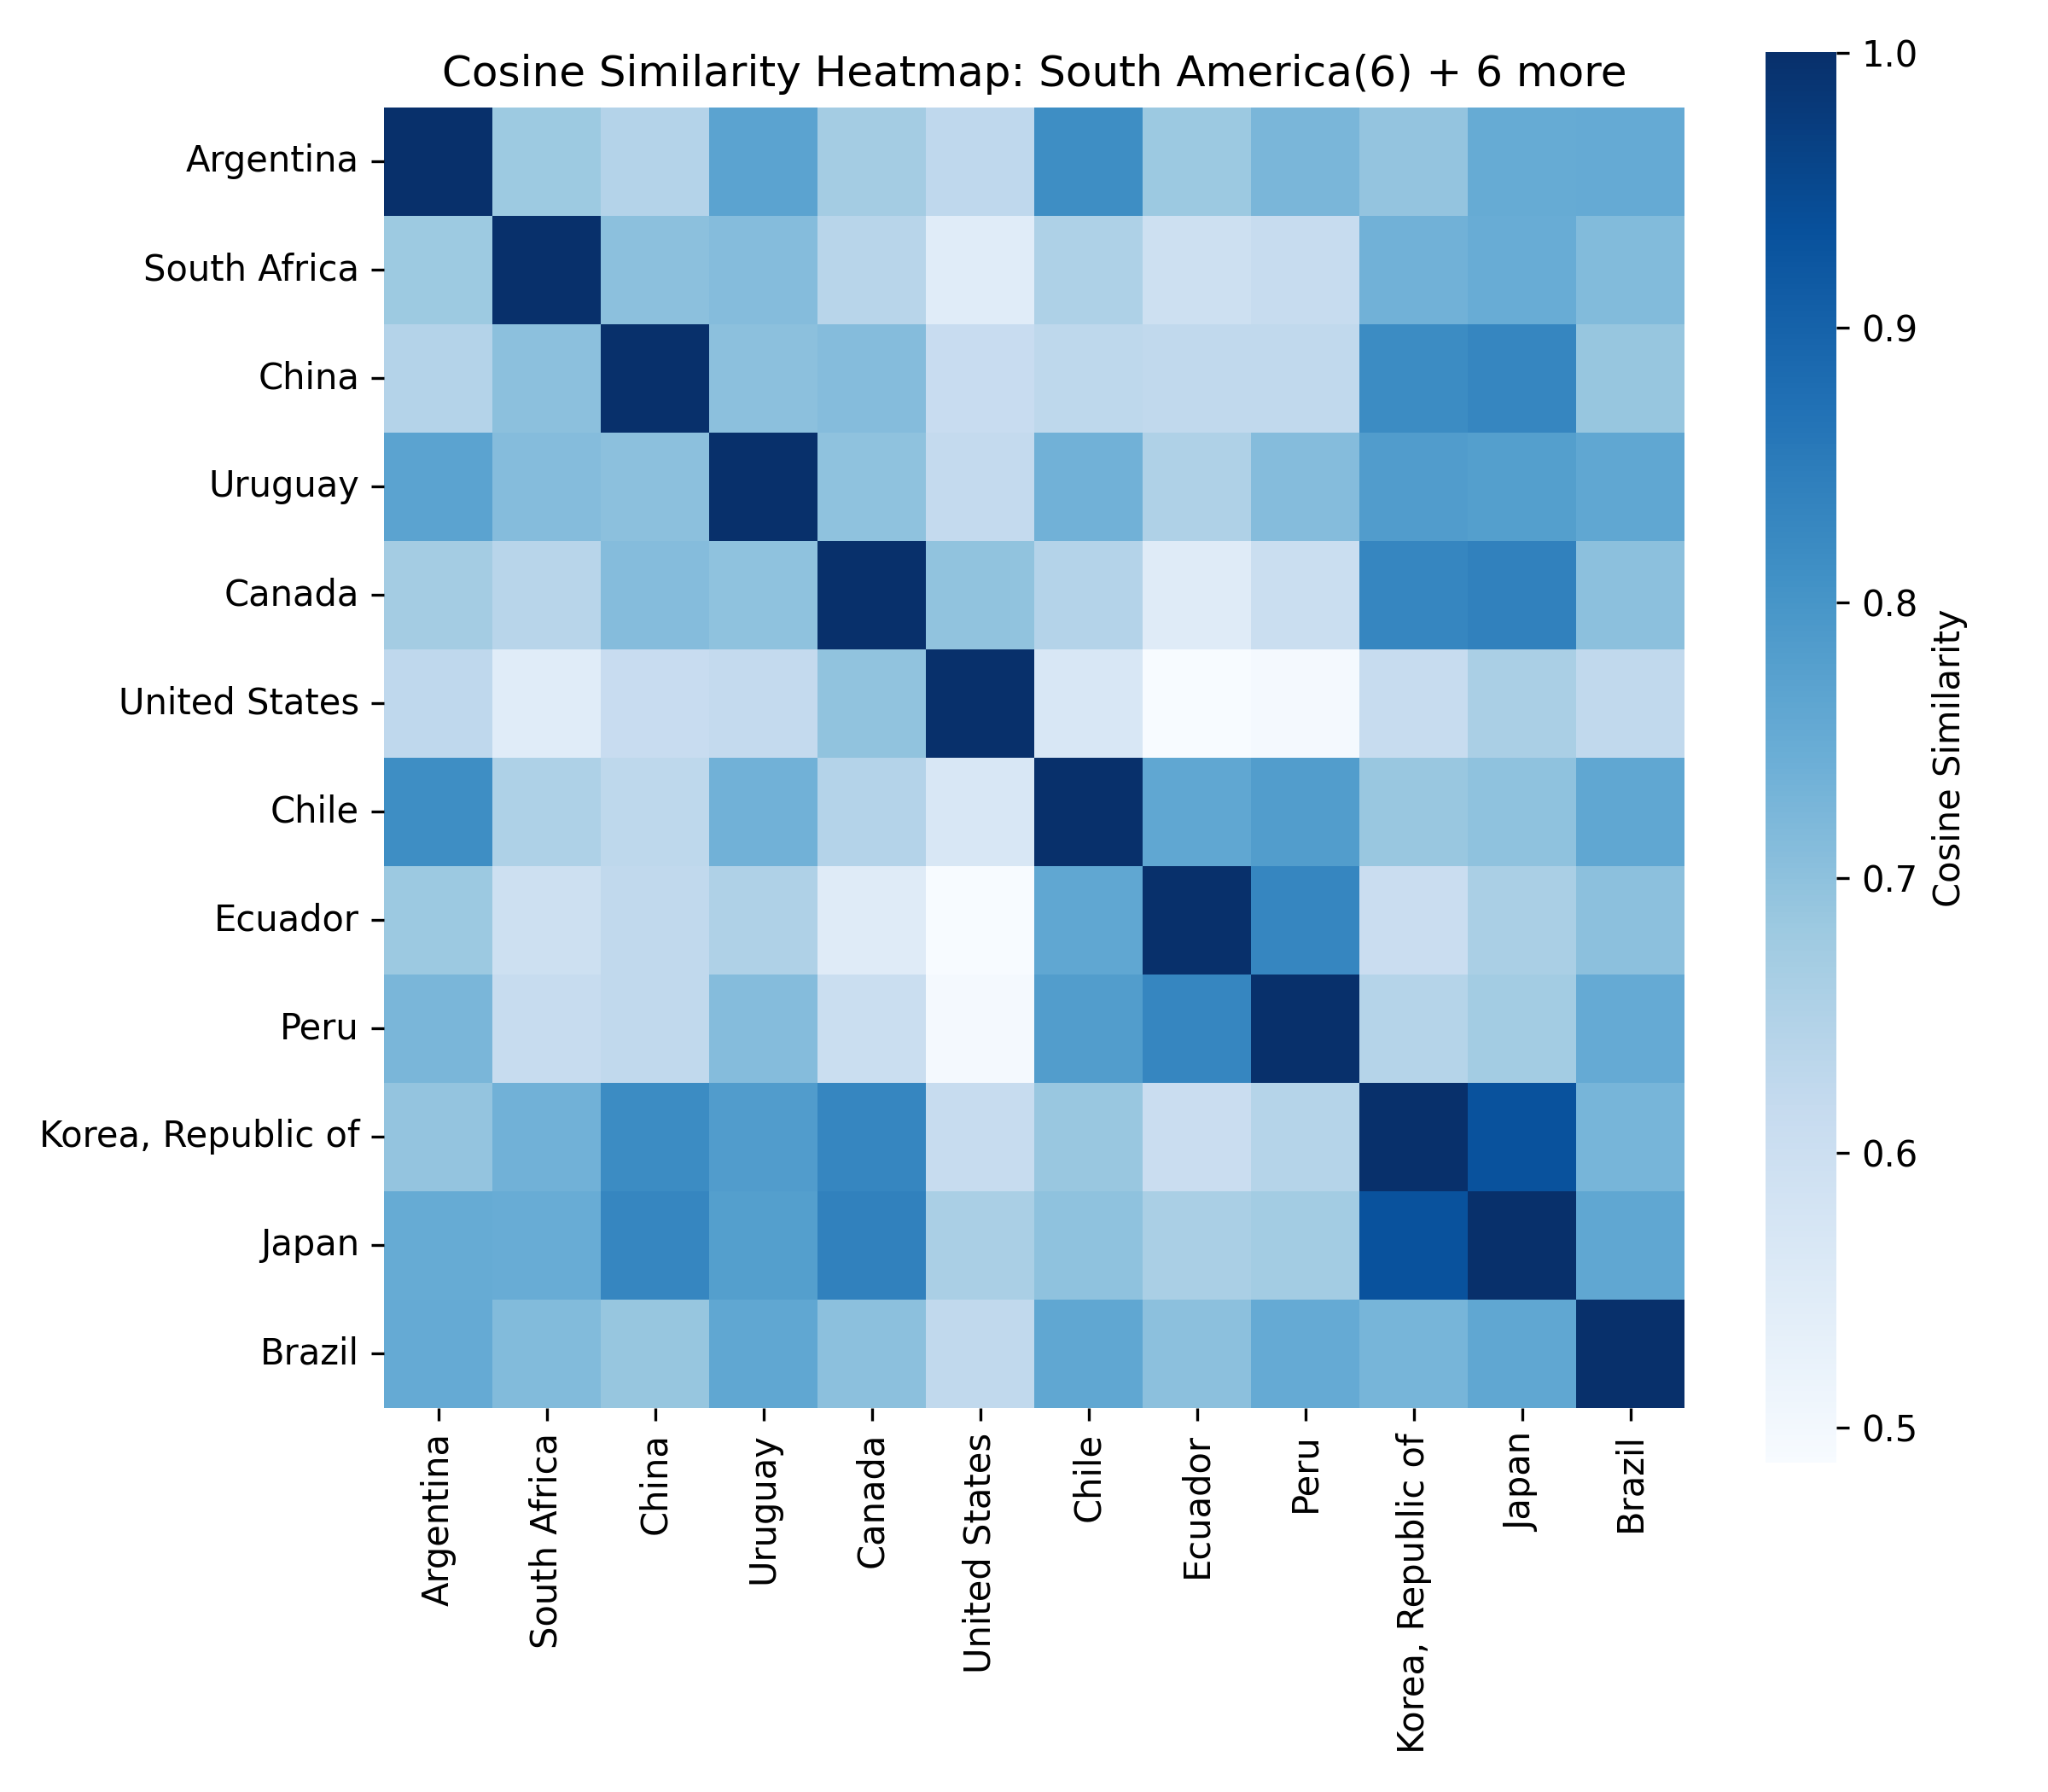
For each of the eight clusters we produce three diagnostic visualisations: a PCA projection (how similar countries are to each other in two dimensions), a dendrogram (which countries form sub-groups), and a cosine-similarity heatmap (direct pairwise overlap). Click a view type to browse all eight clusters.
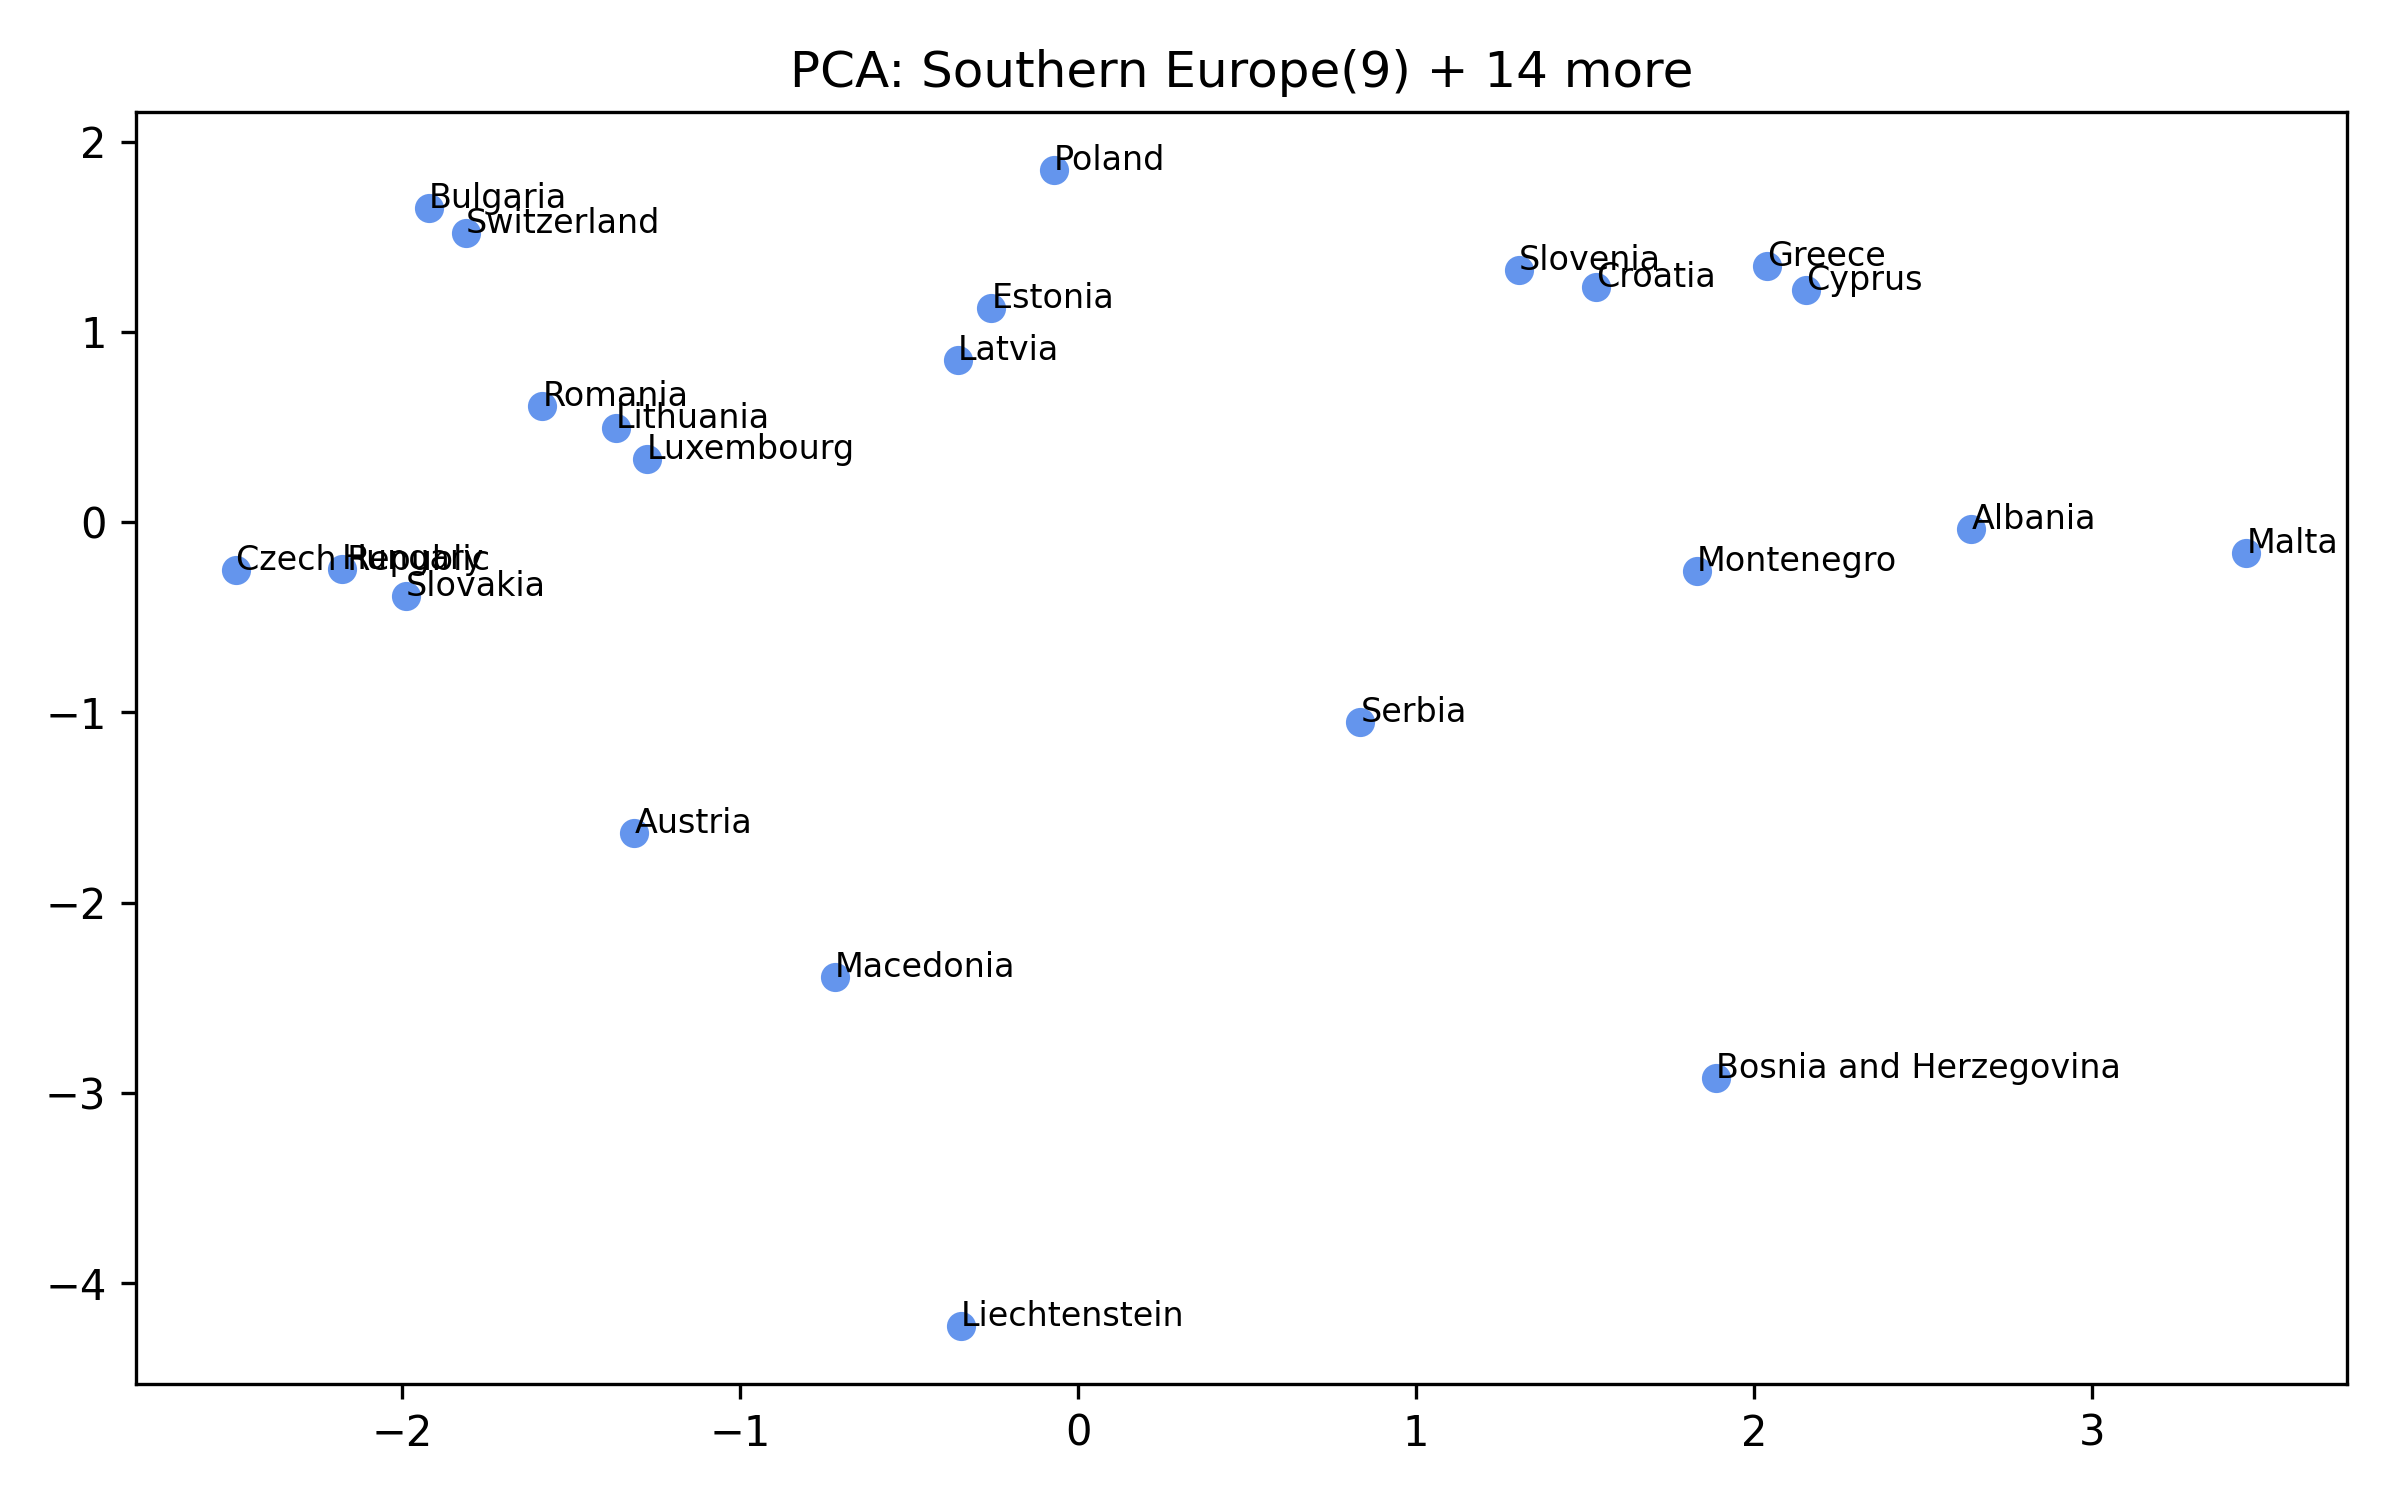
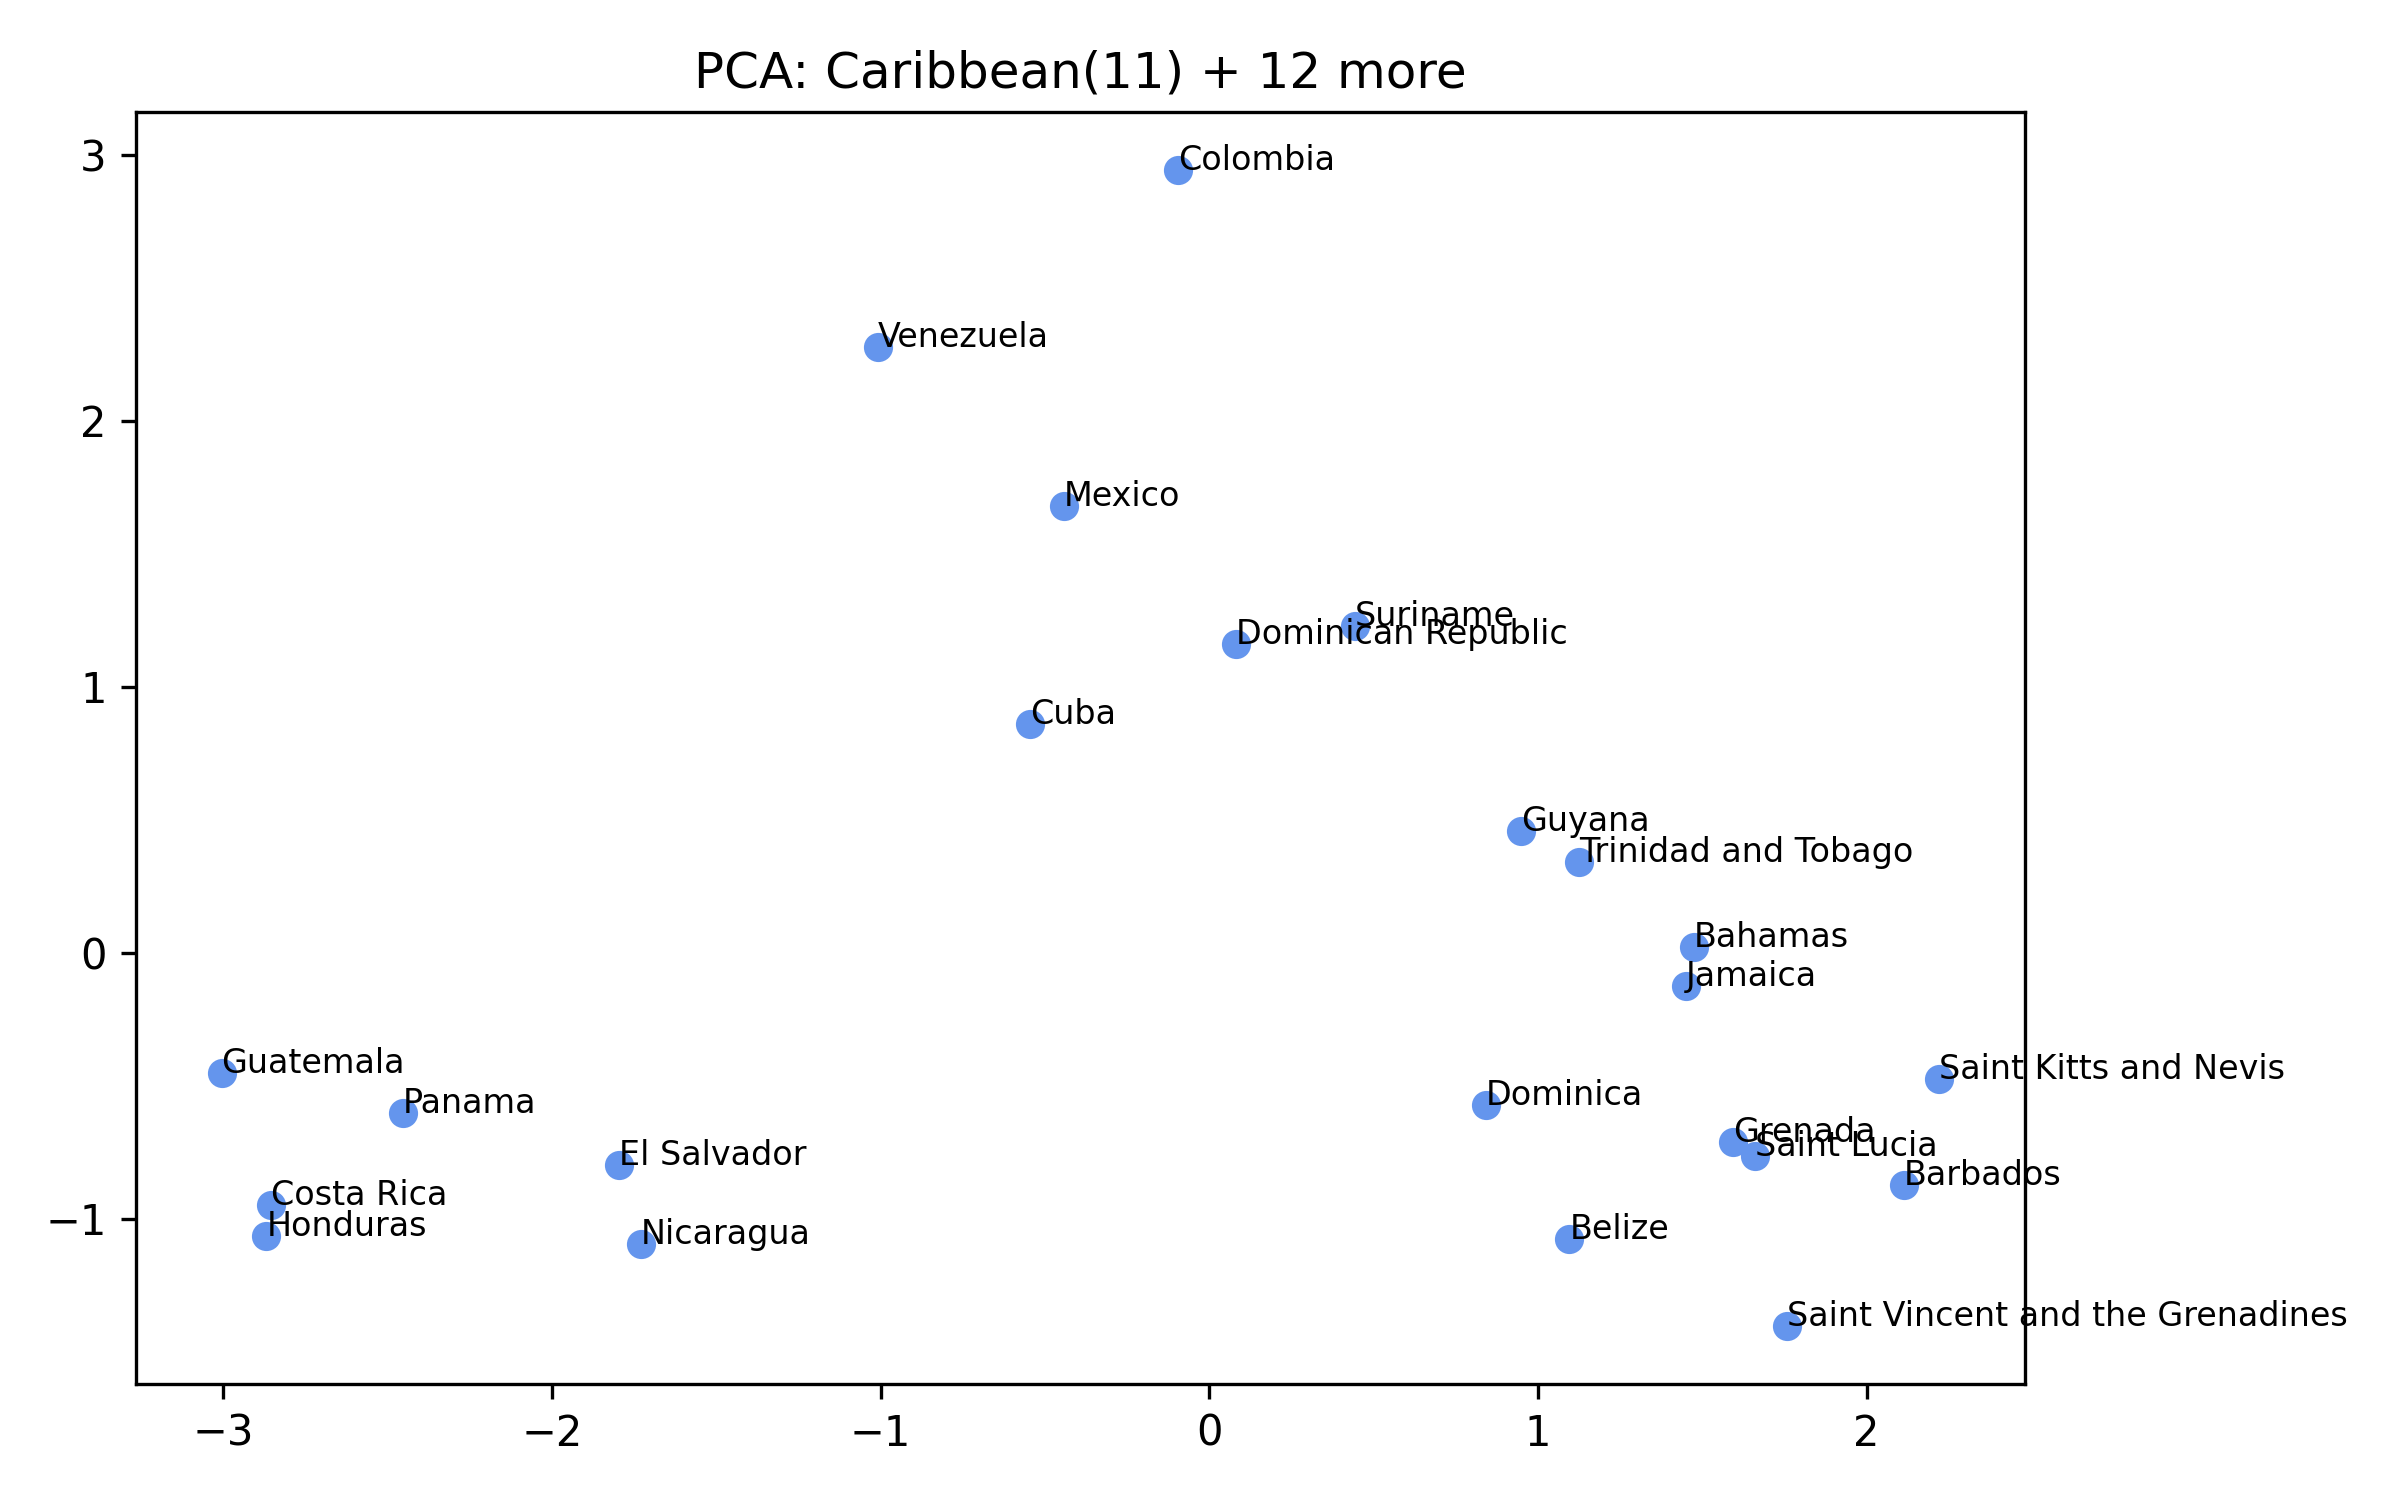
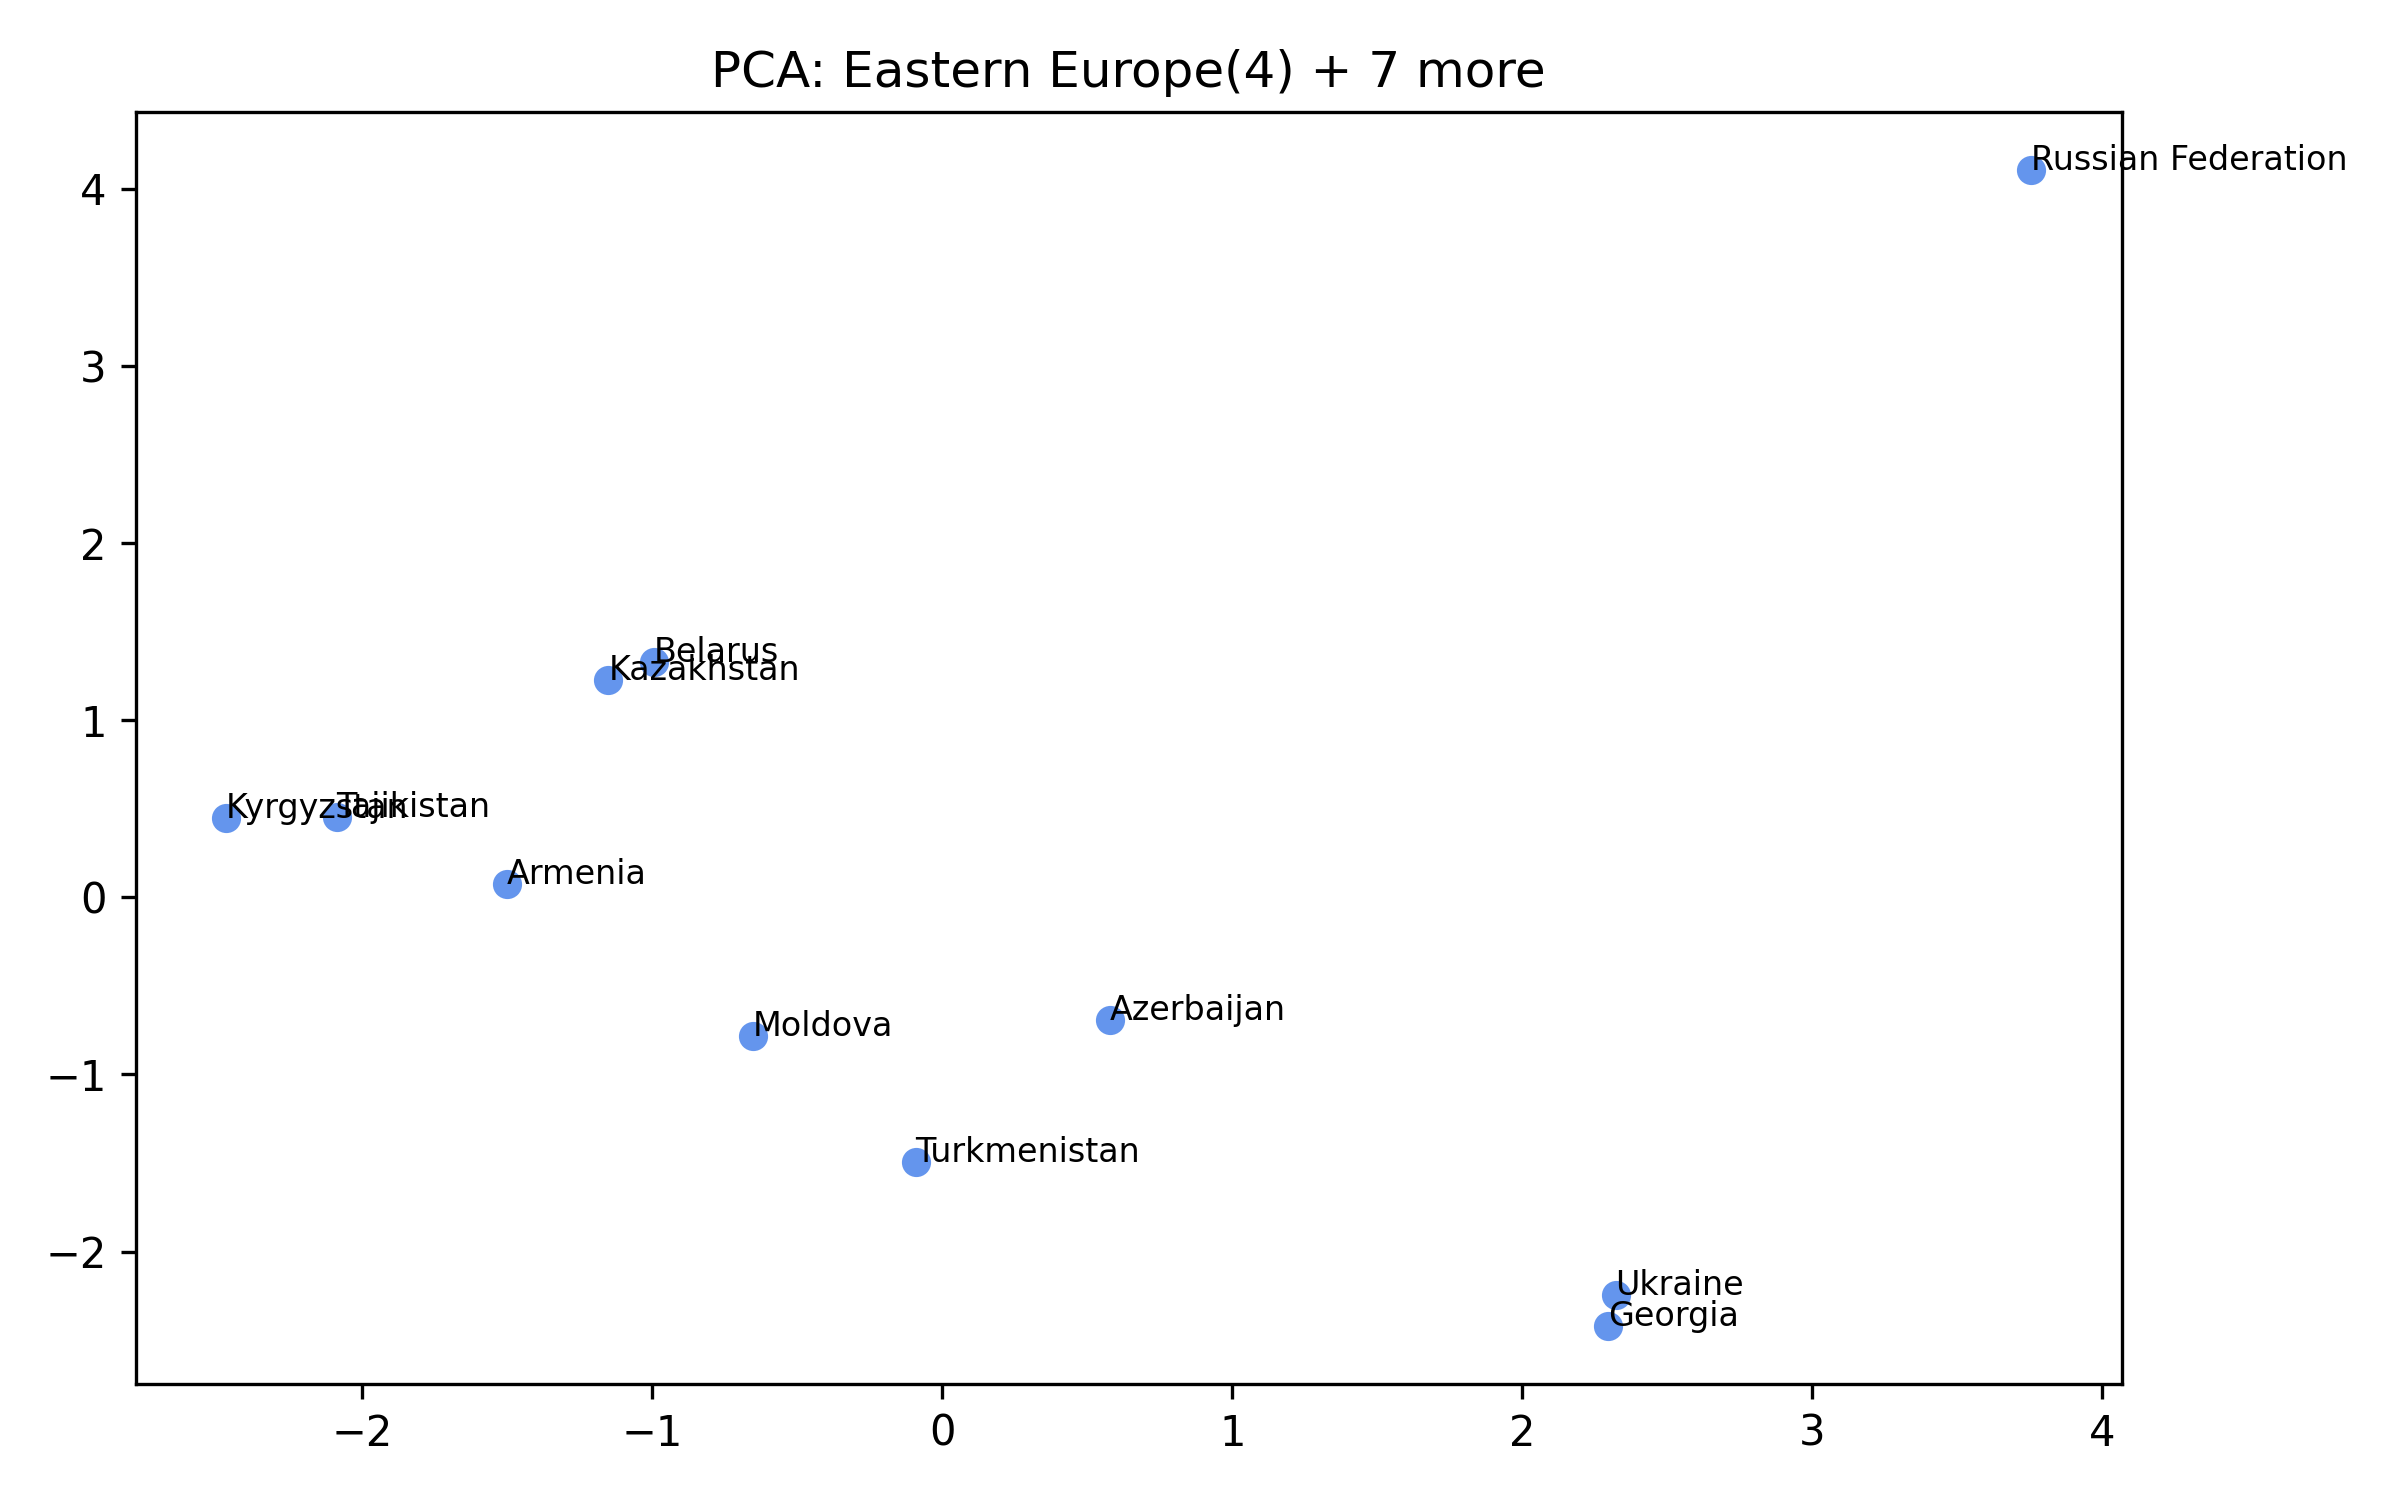
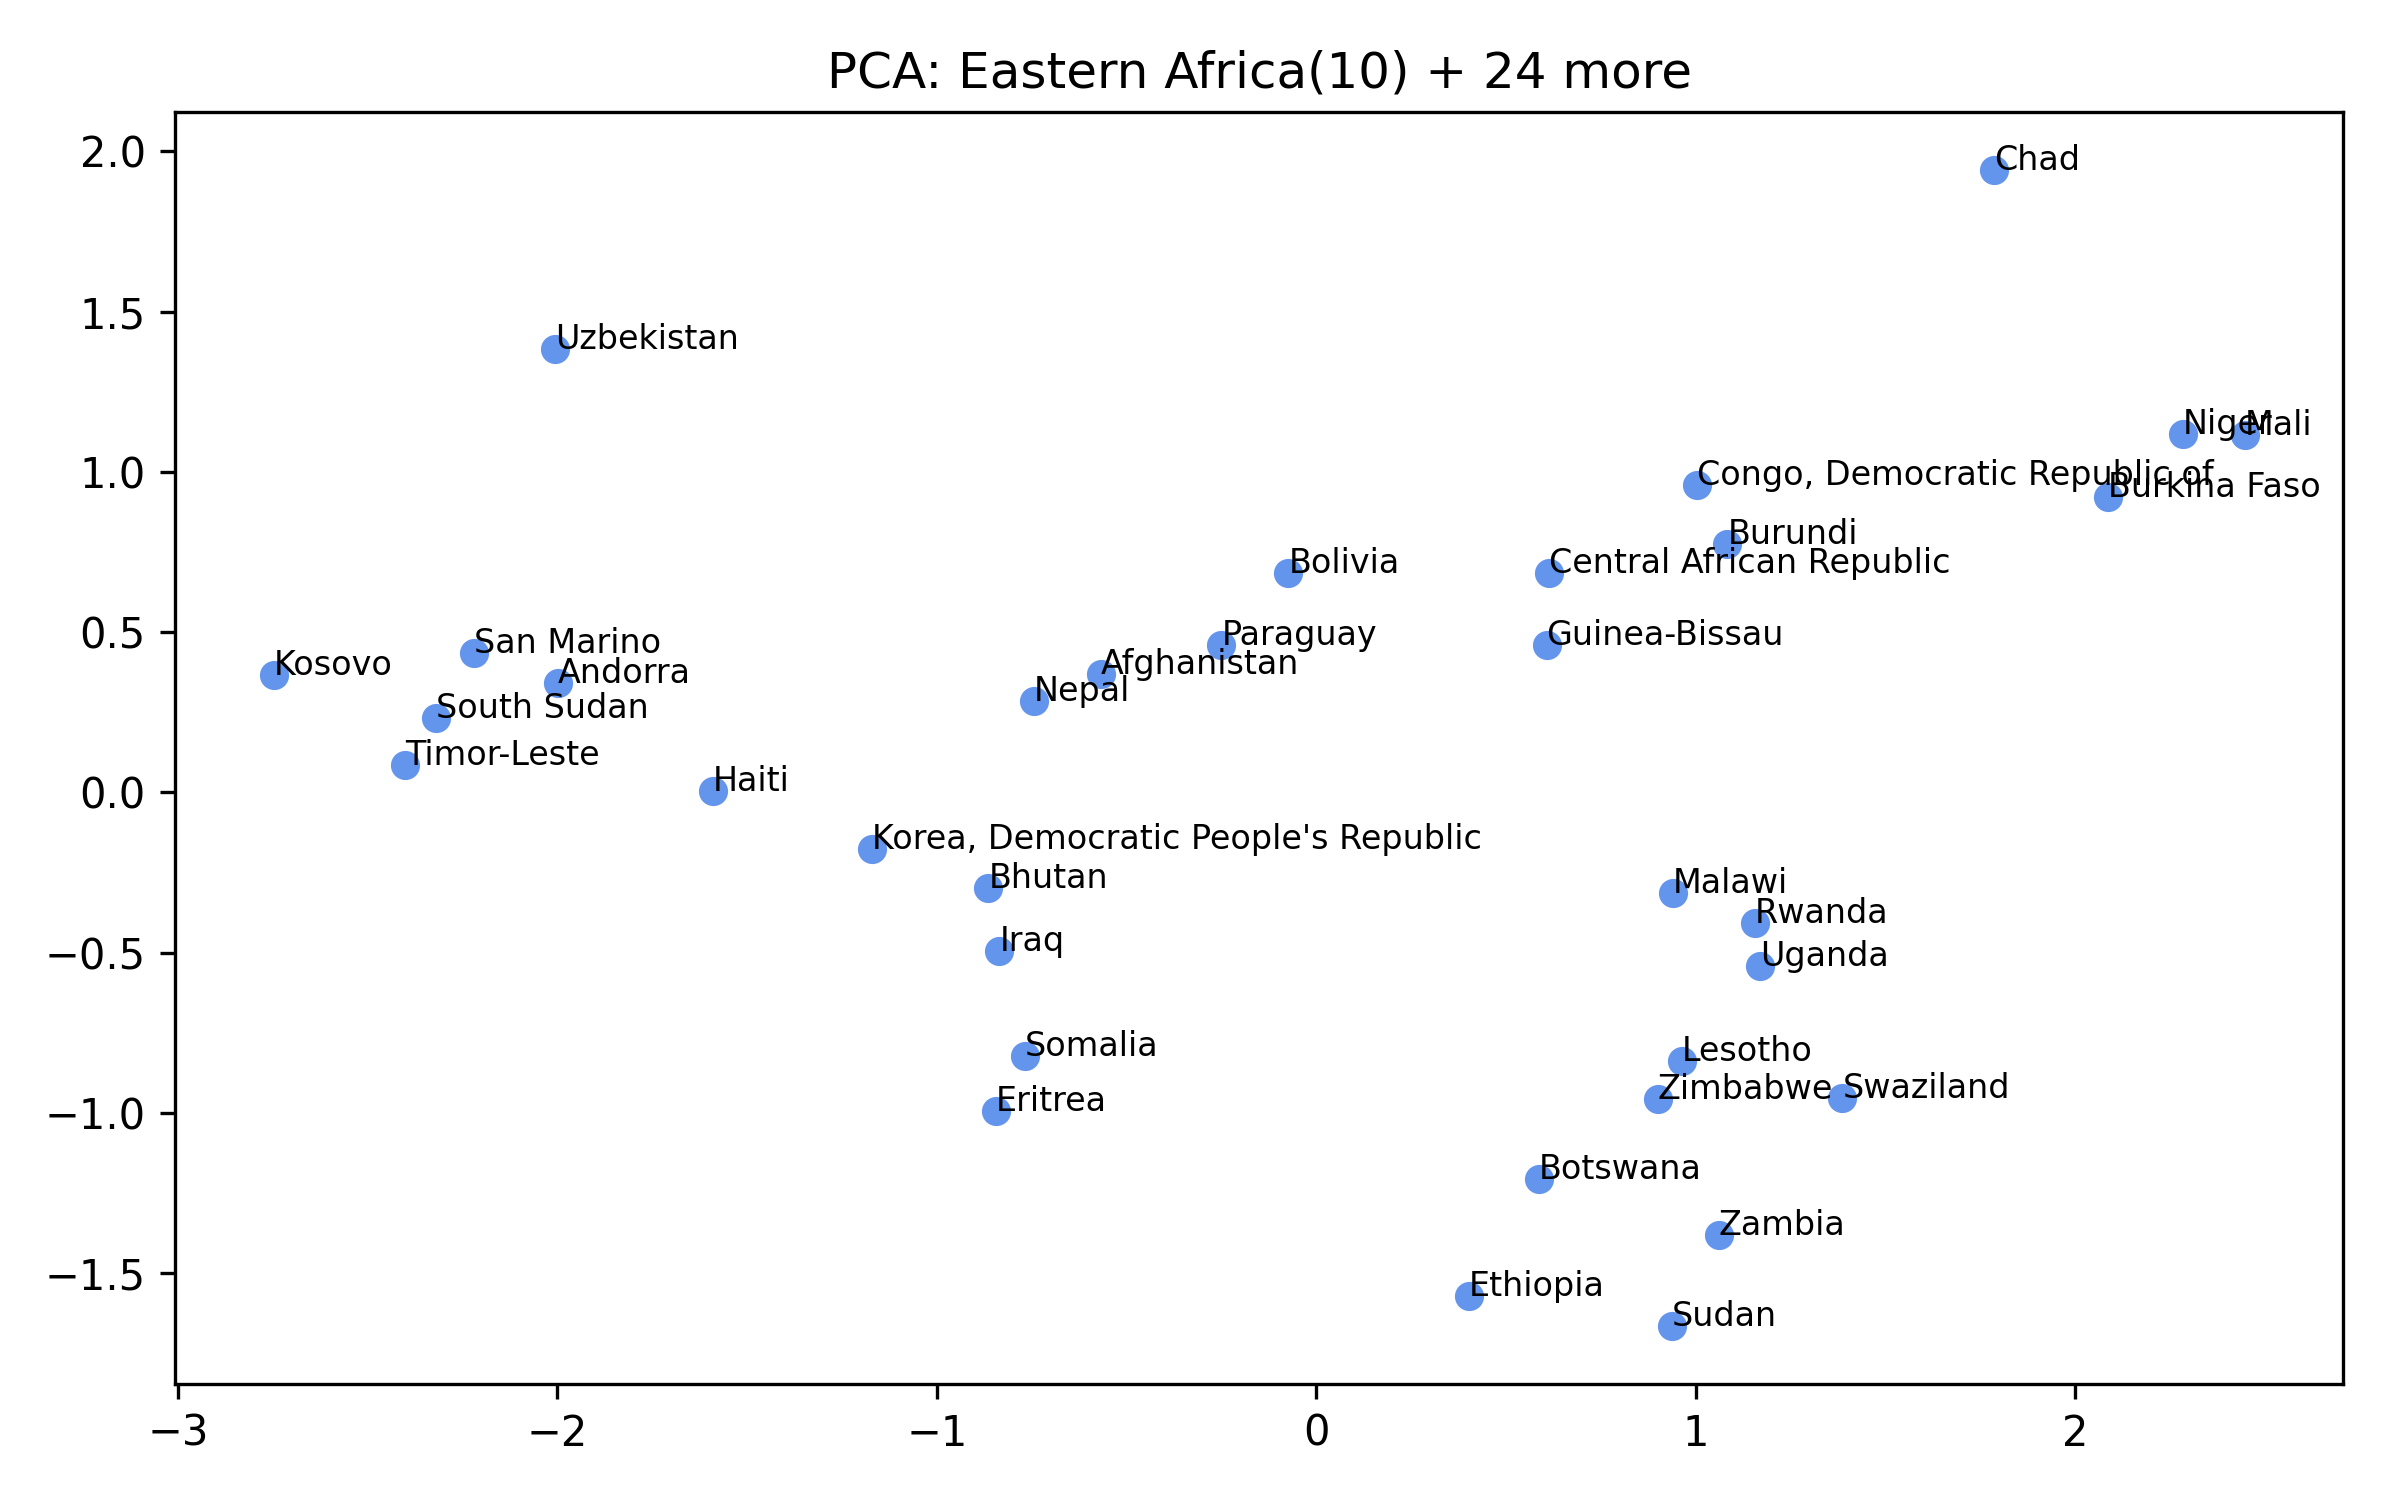
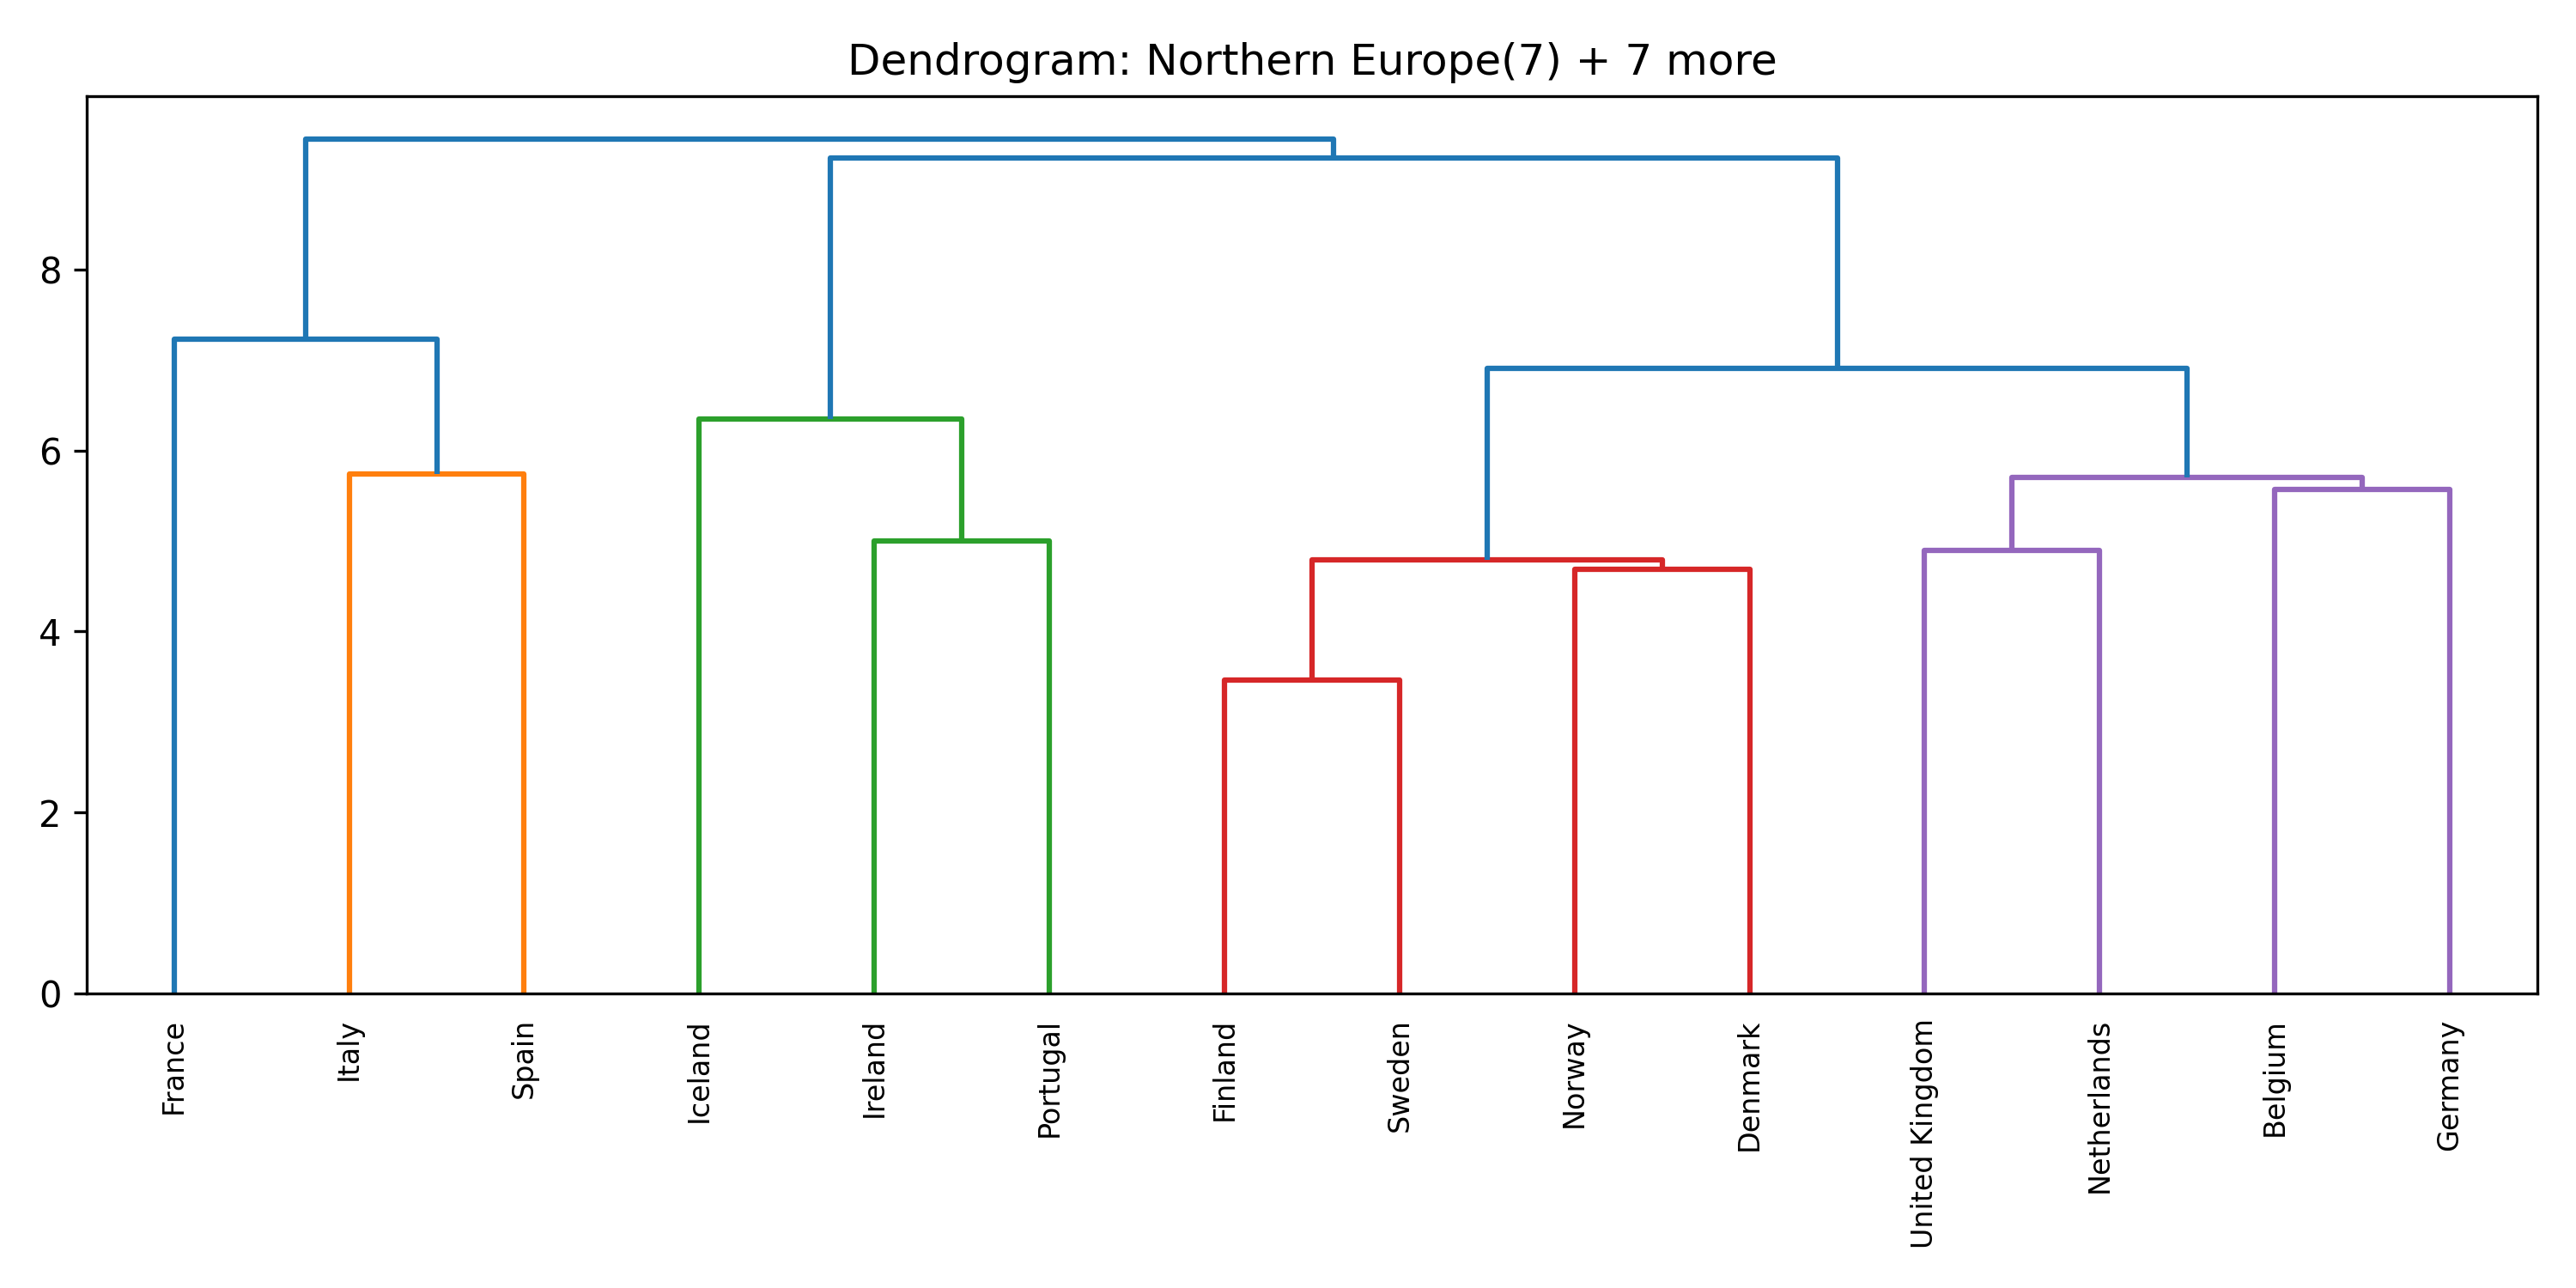
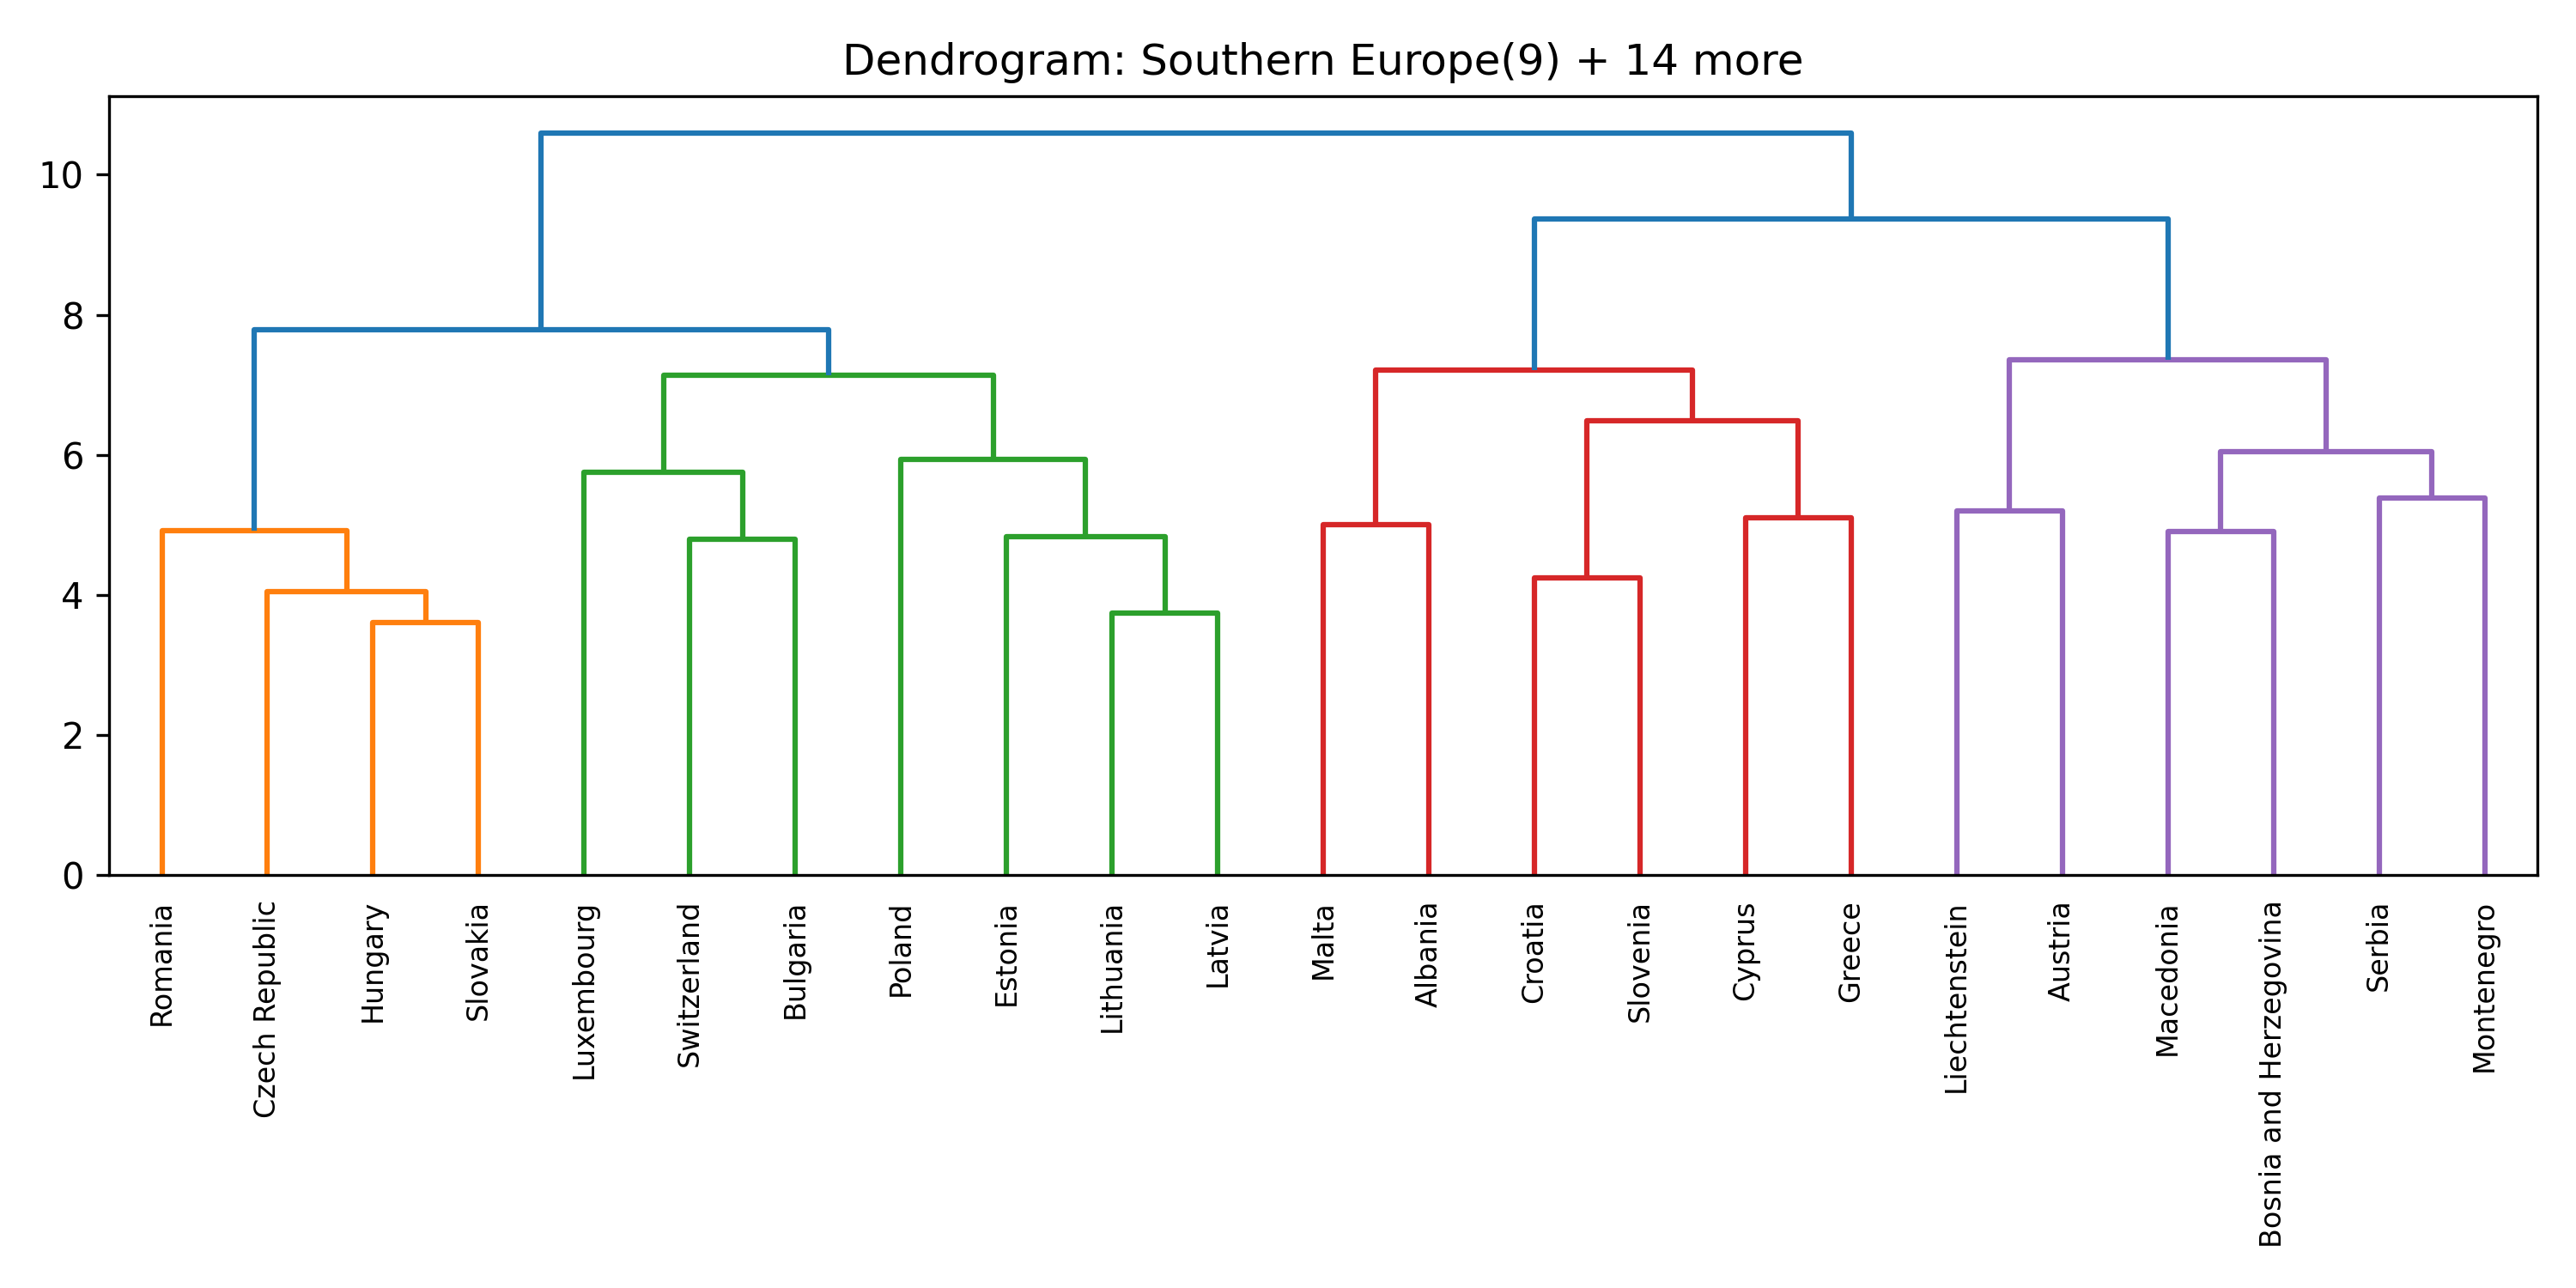
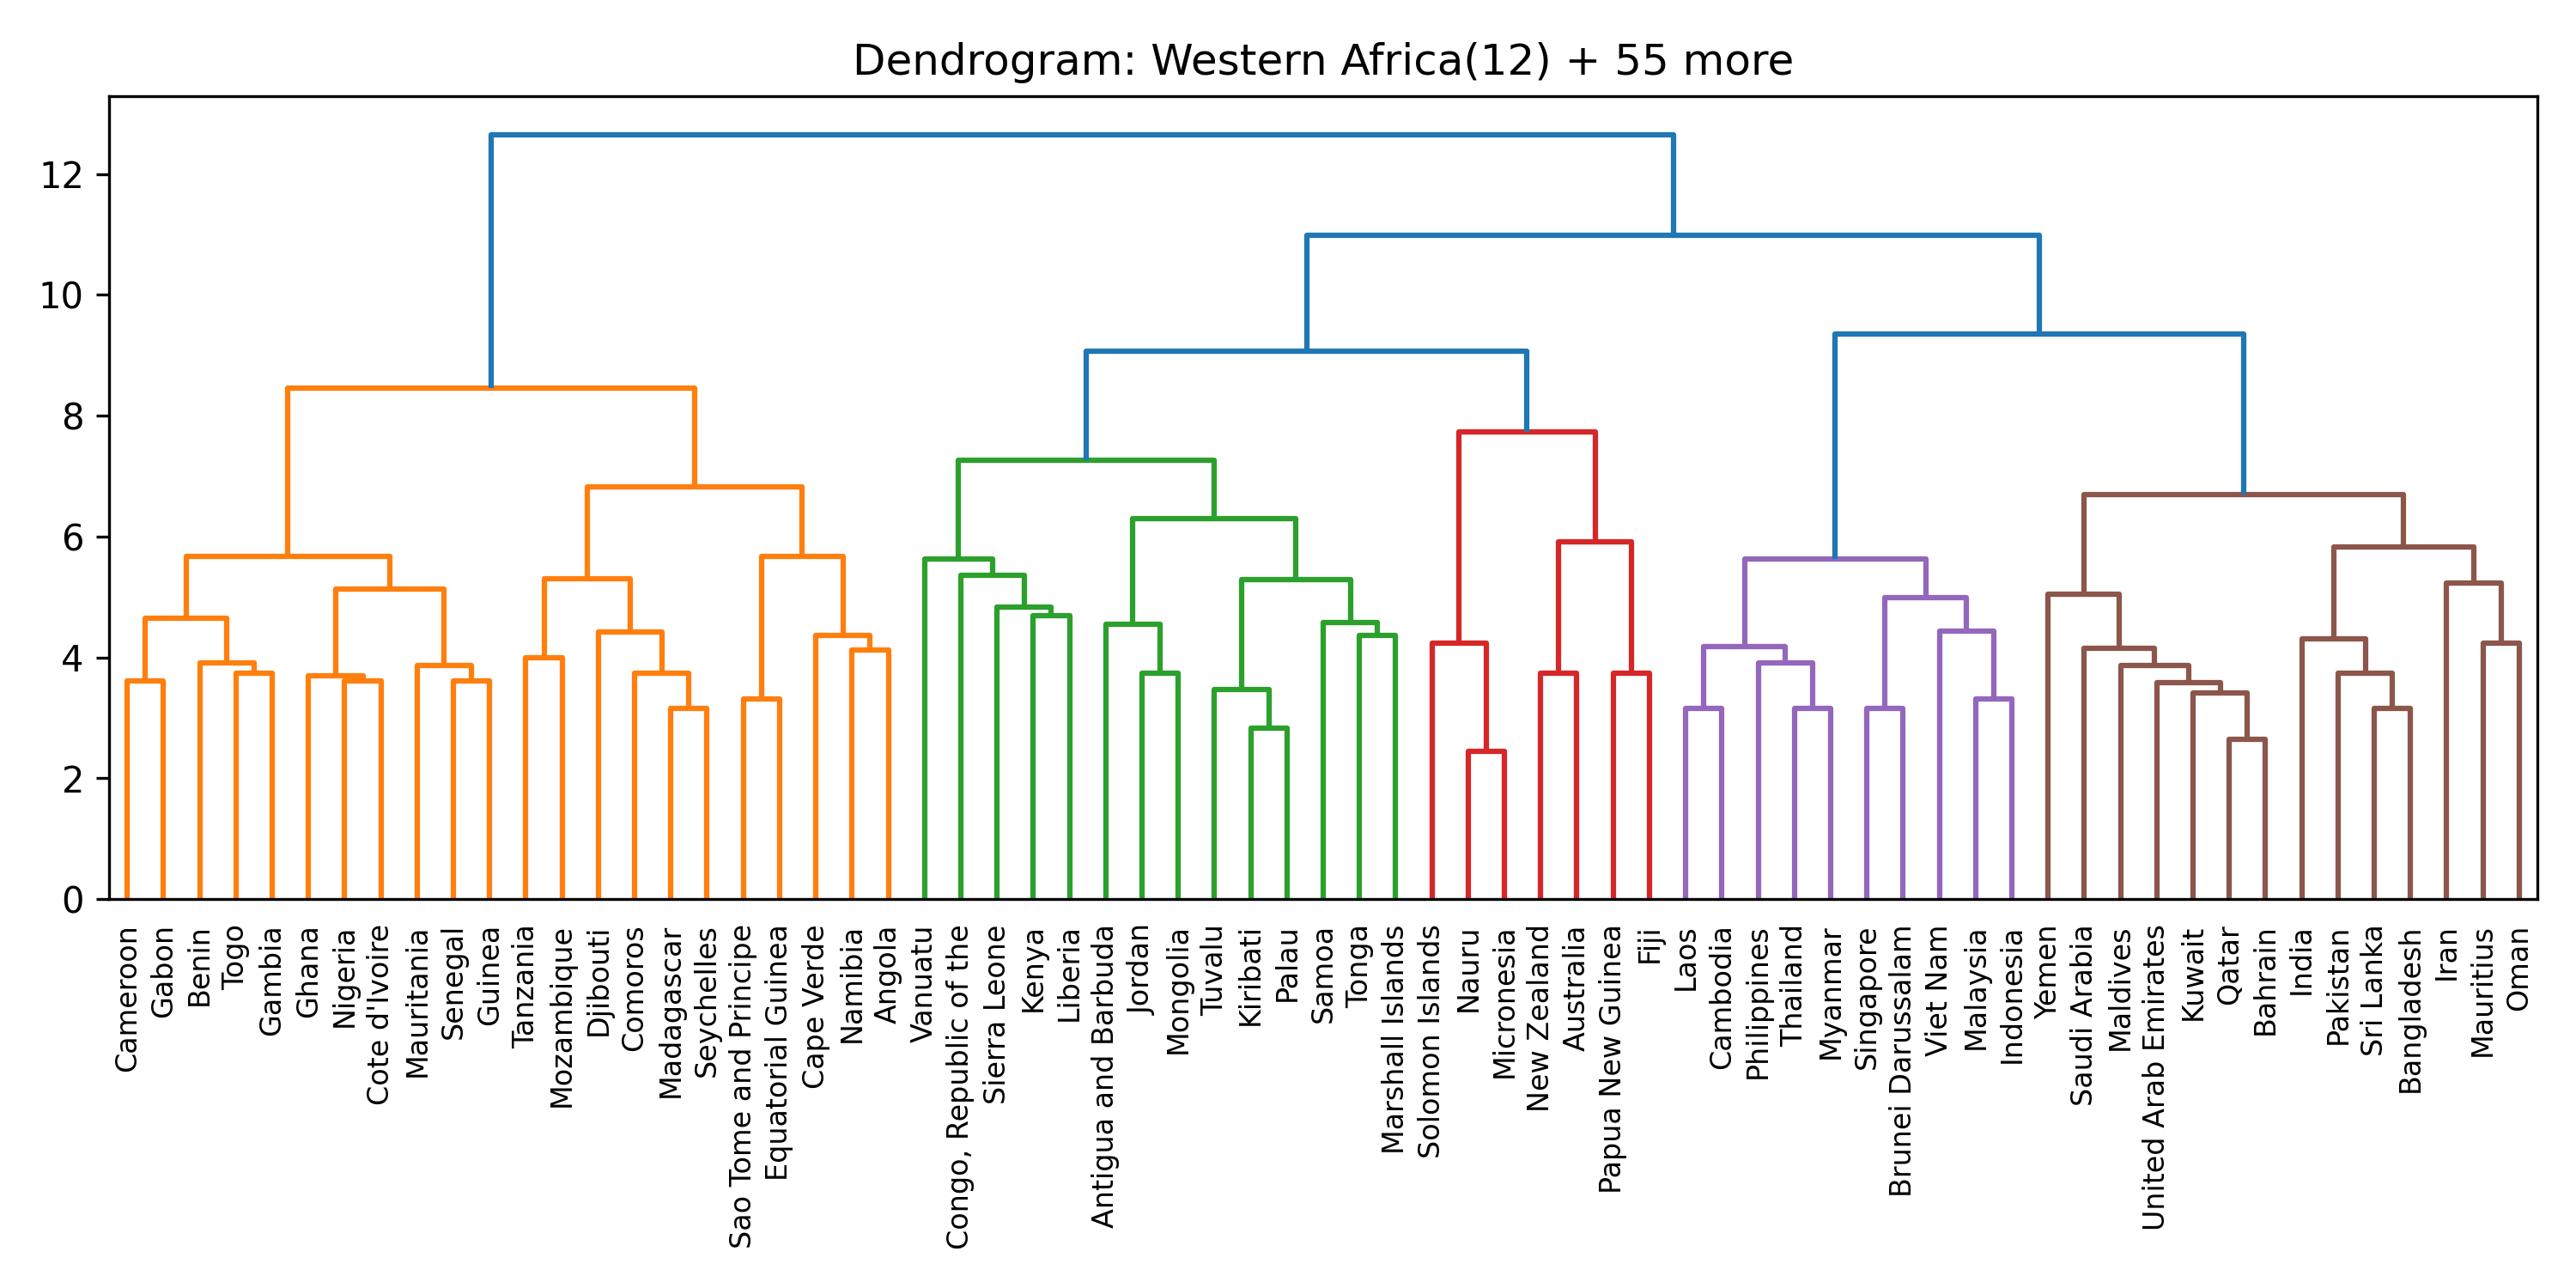
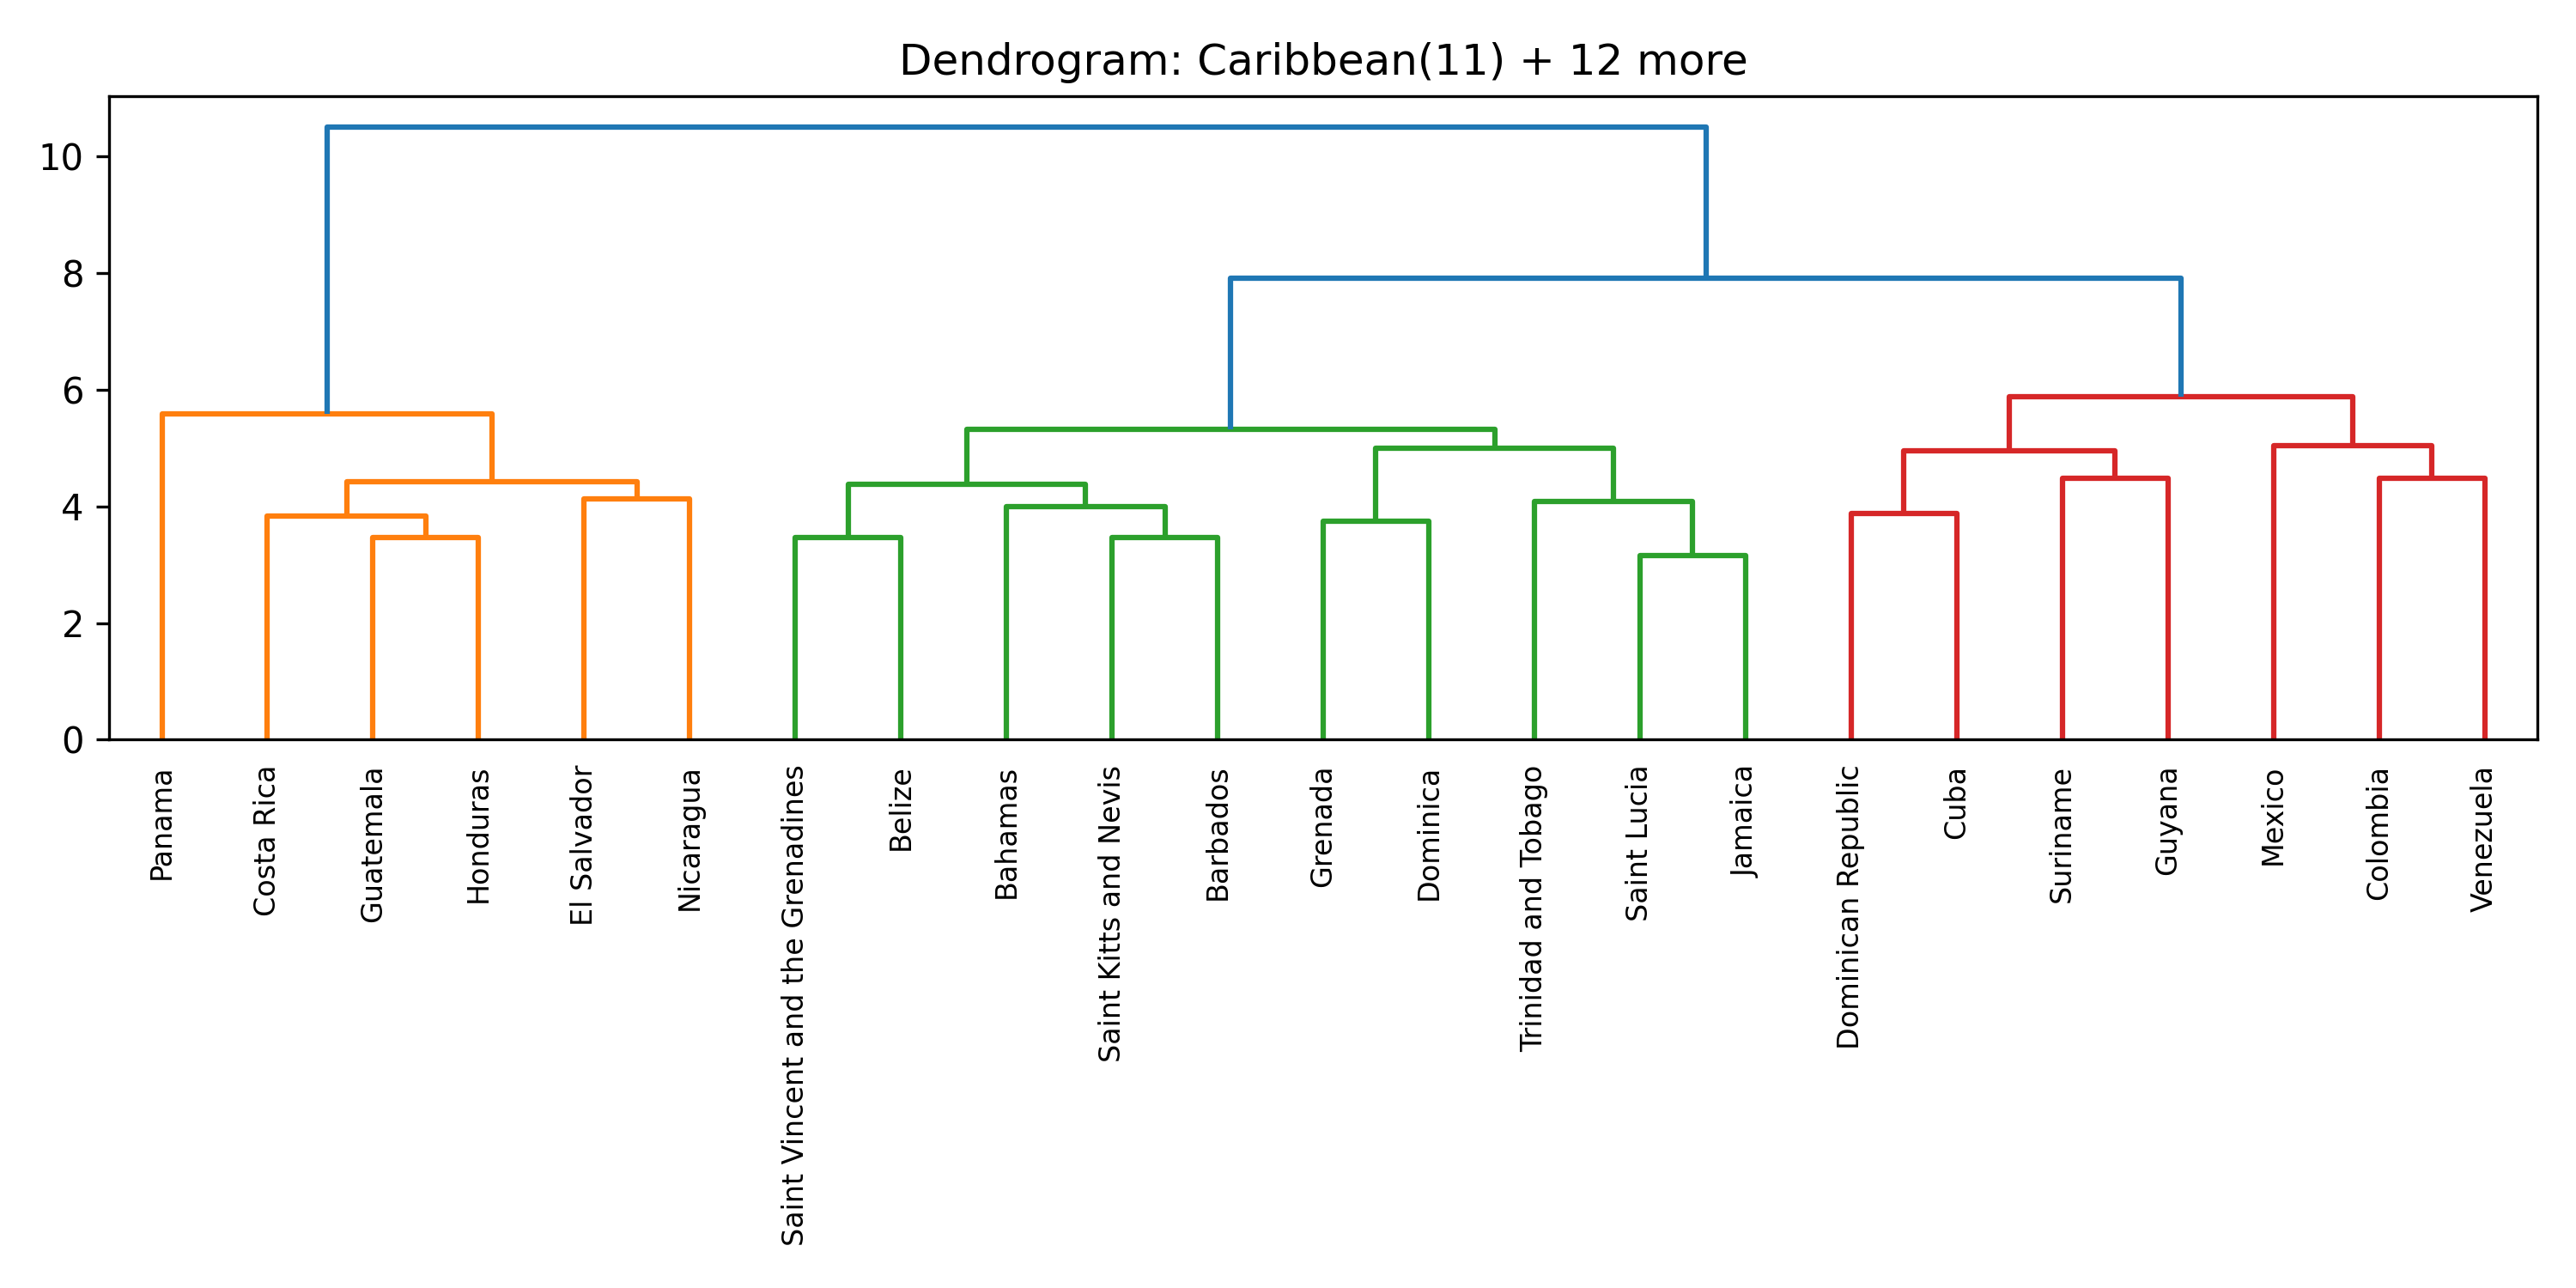
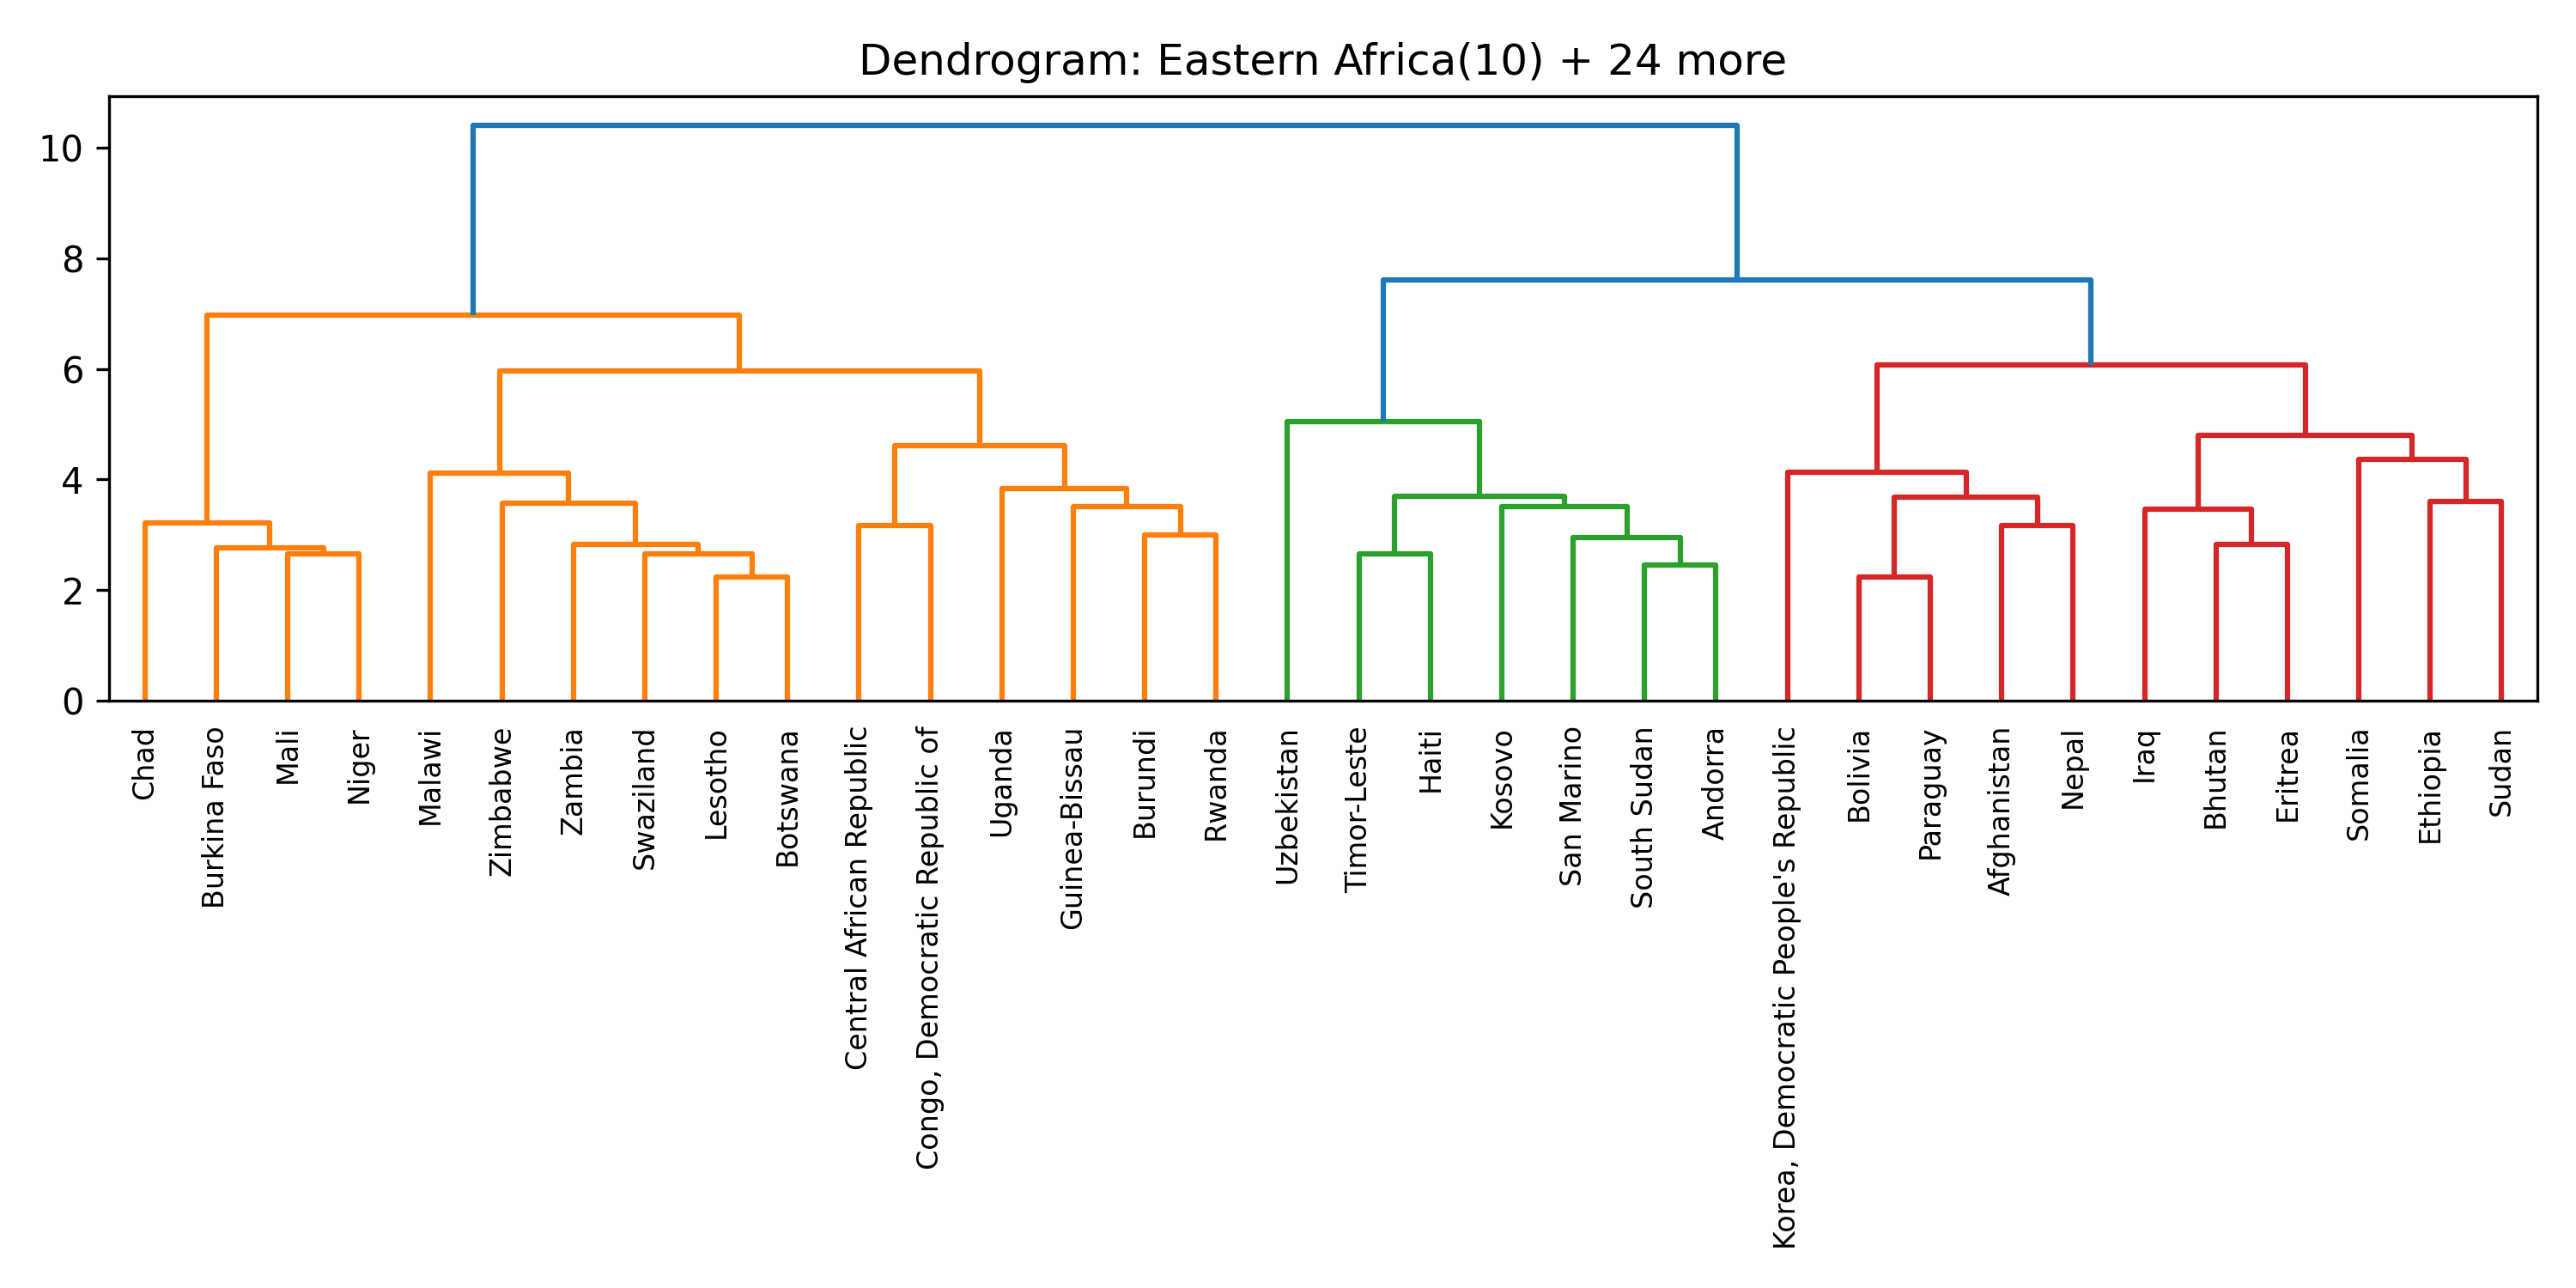
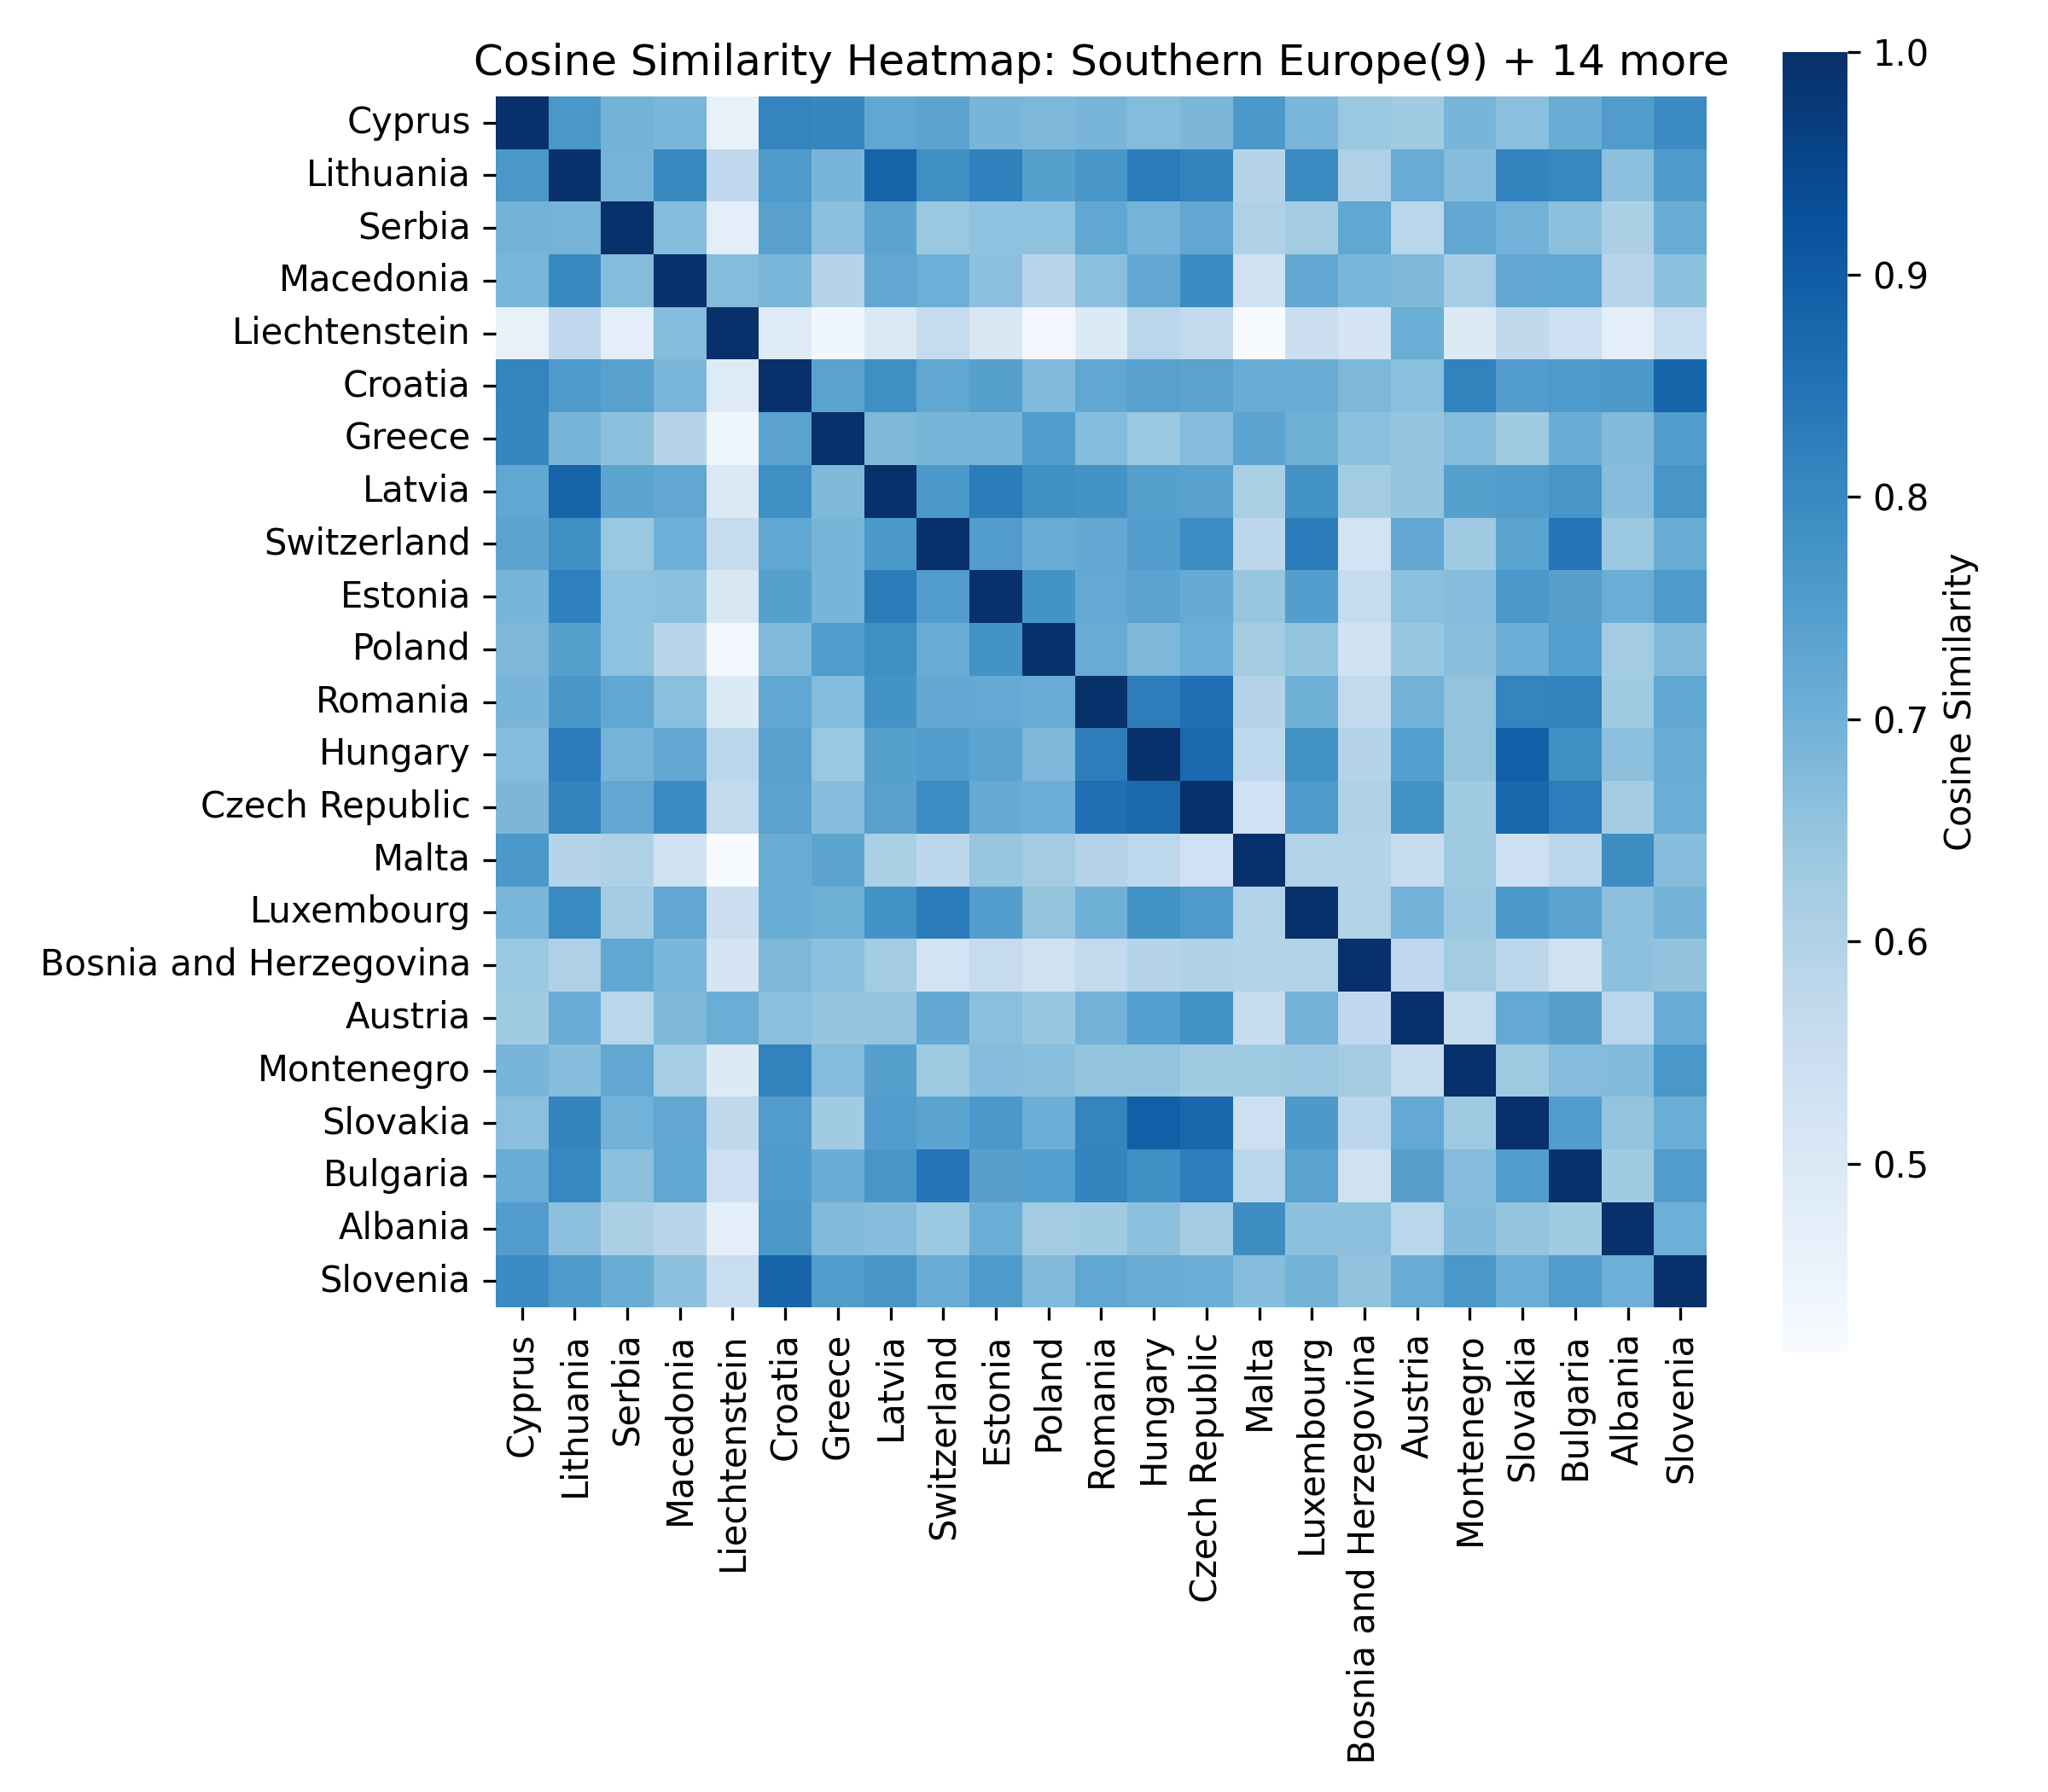
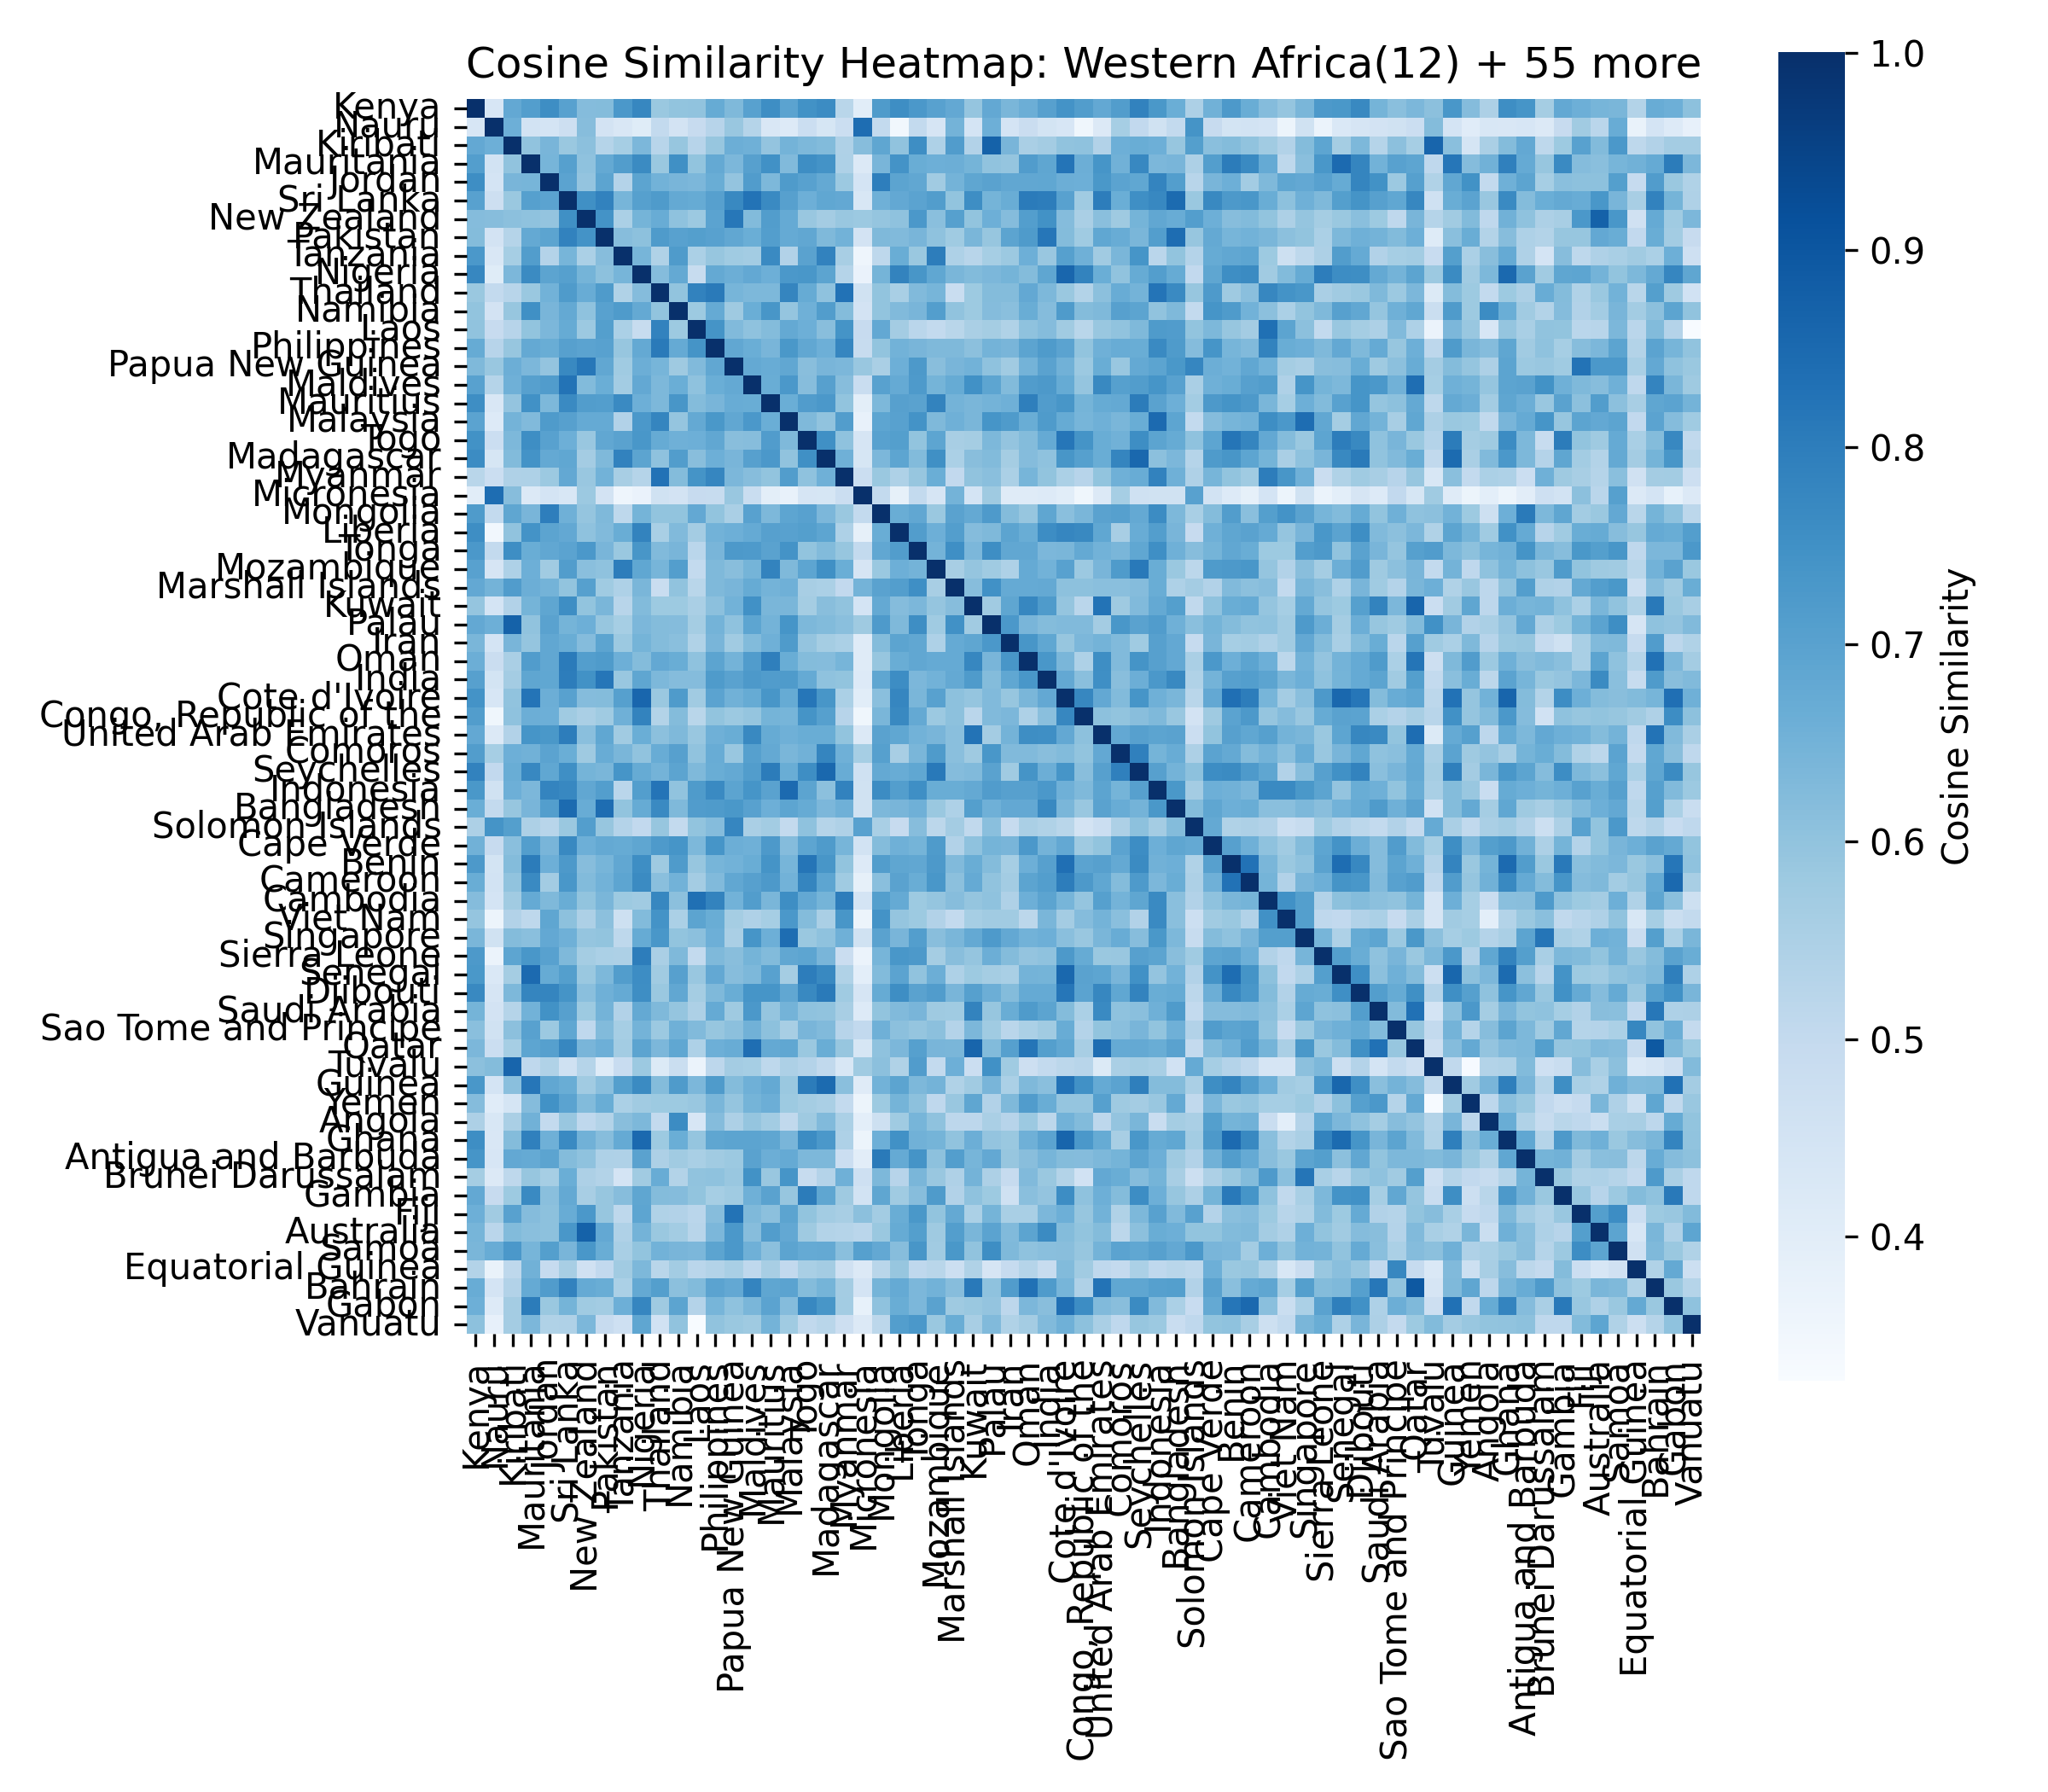
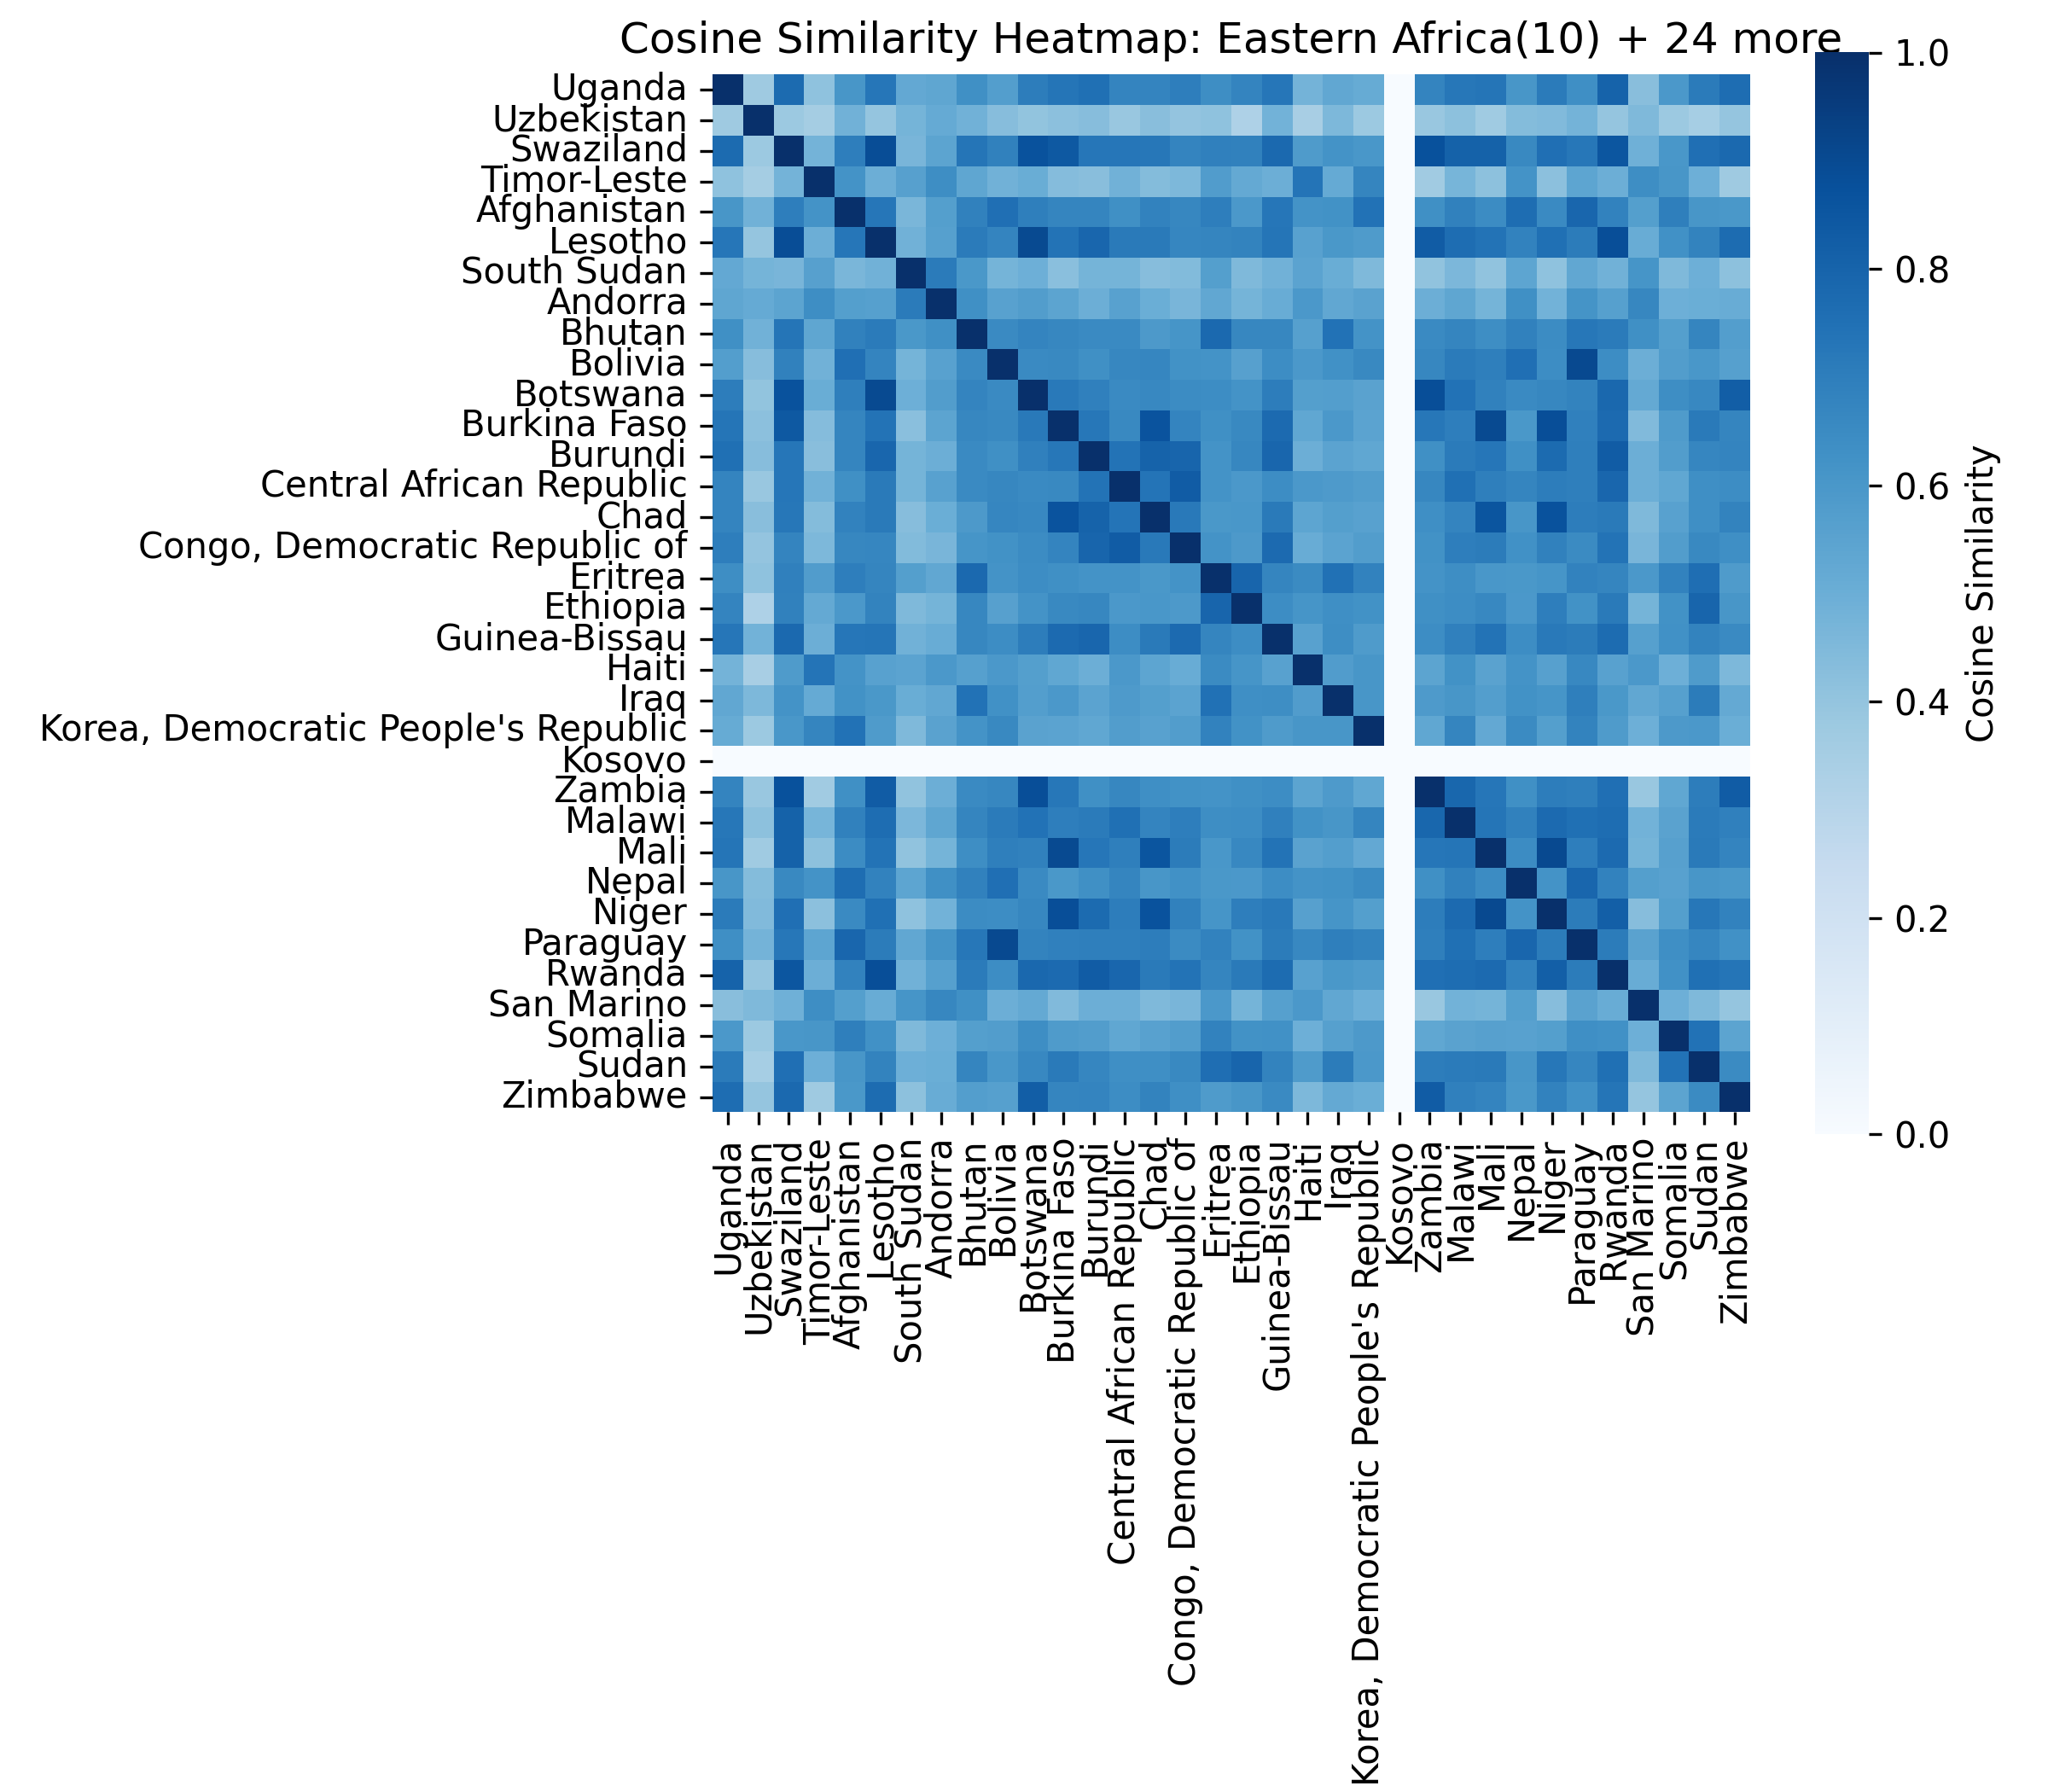
Cluster 5 is notably large and its dendrogram suggests at least three coherent sub-groups — an opportunity for finer-grained analysis in future work.
Searching for tipping coalitions
How many possible coalitions are there?
With 175 non-G20 countries, the number of possible coalitions of size 2 to 4 alone is:
This combinatorial explosion means exhaustive search is only feasible for small coalition sizes (up to 4 members, taking around 30 minutes). For larger coalitions we need smarter approaches — a greedy forward-selection algorithm and a reinforcement learning agent.
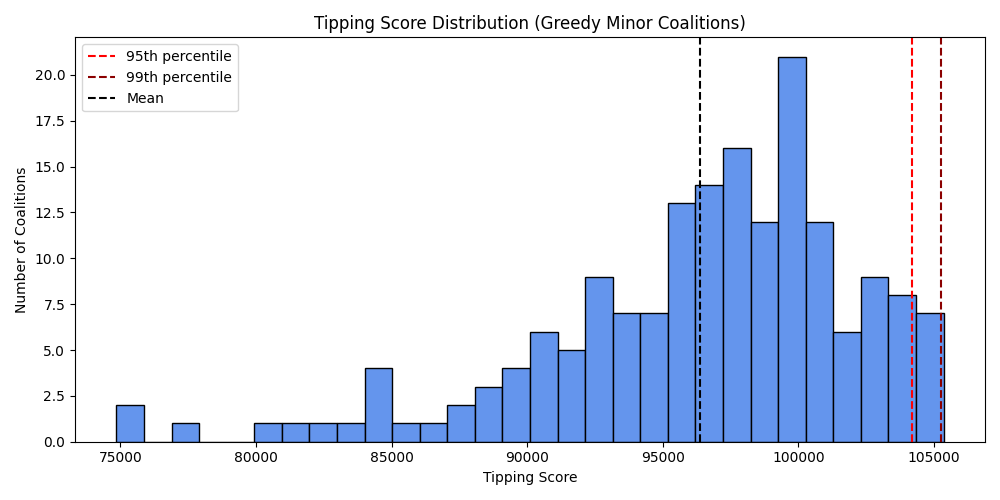
The tipping score
Every coalition is scored using three components, multiplied together:
| Component | What it measures |
|---|---|
| Alignment | Average pairwise cosine similarity of treaty ratification profiles within the coalition — how coherent the group is |
| Influence Spread | Total treaty co-ratification overlap from coalition members to all non-members — how much reach the coalition has |
| Cluster Diversity | Number of distinct treaty communities represented — how many independent influence channels are activated |
The vulnerability scores (ND-GAIN + WRI Aqueduct) are incorporated as a multiplicative bonus: coalitions that include climate-exposed nations score higher, creating an incentive to include frontline voices without hard-coding their membership.
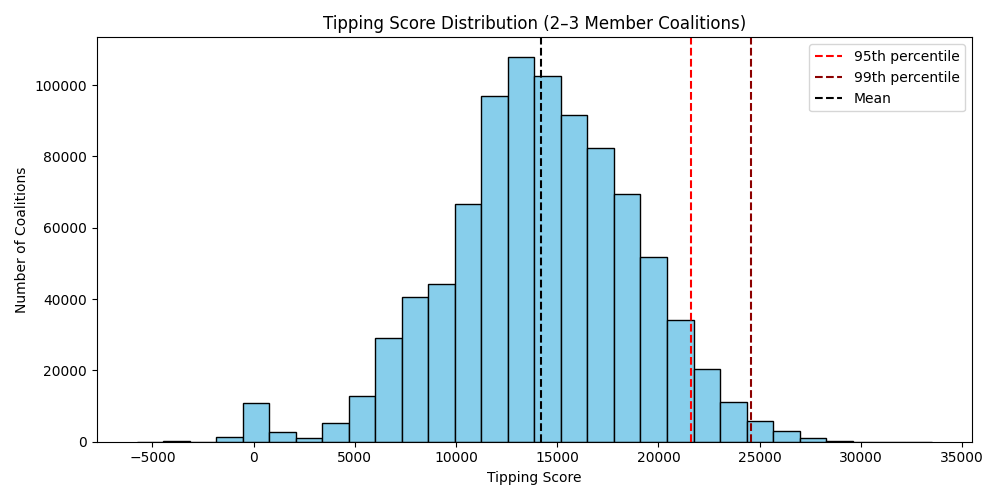
Score distribution across 38.6 million coalitions
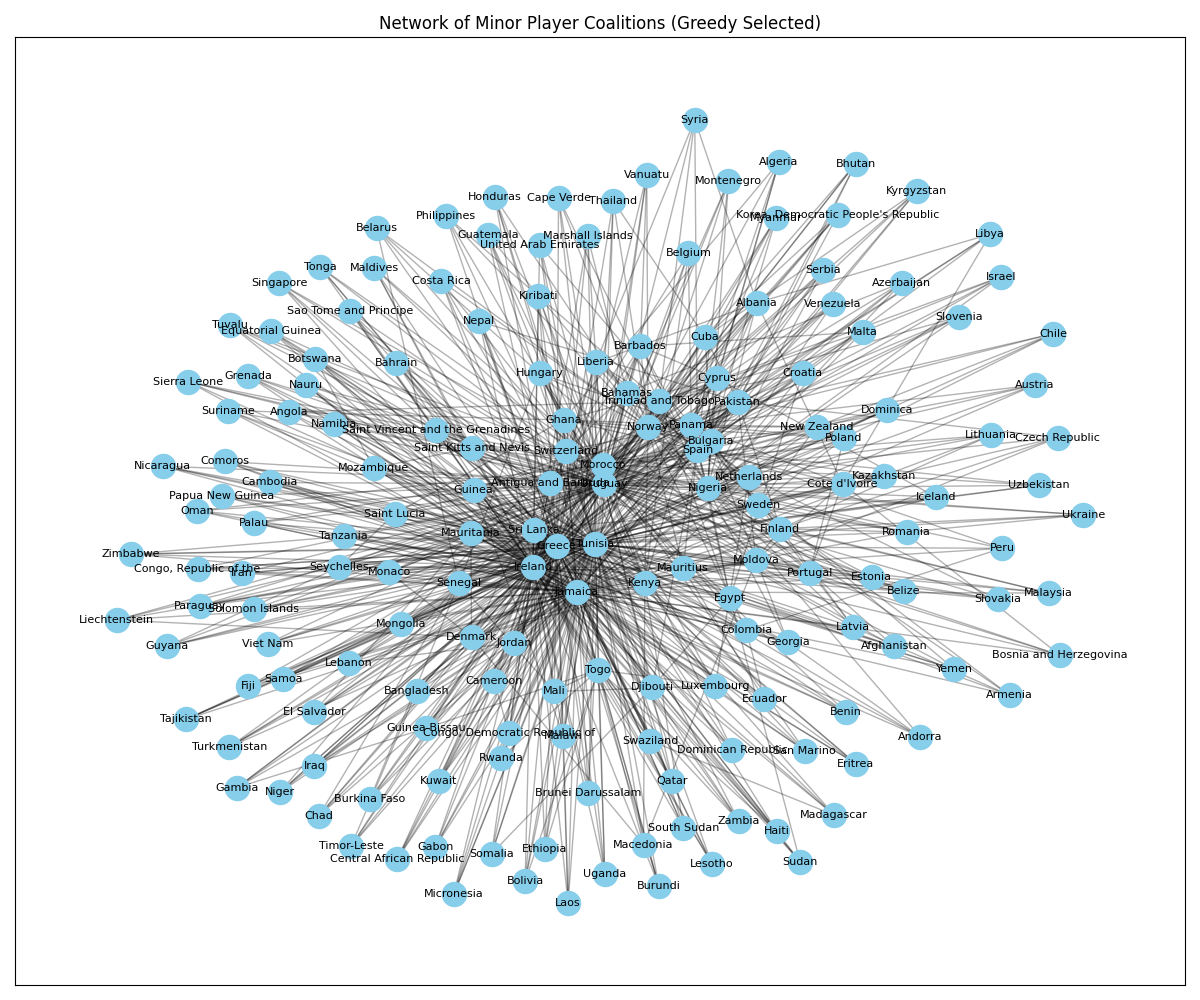
Greedy forward selection
The greedy algorithm builds a coalition one member at a time, always adding the country that produces the largest score increase. It operates in seconds rather than hours. The top coalition found by greedy search — Mauritius, Jamaica, Ireland, Greece, Tunisia, Uruguay — achieves a tipping score of 105,353 and spans 6 of 8 treaty clusters.
Using machine learning to explore larger coalitions
For coalitions of up to 8 members, we train a reinforcement learning (RL) agent using the REINFORCE algorithm with Gumbel top-K sampling.
In plain terms: the agent is a small neural network that learns, over 1,000 training rounds, to assign each country a probability of being included in a coalition. At each step it samples a coalition from those probabilities, computes the tipping score, and adjusts its probabilities based on how well it did — like a repeated trial-and-error experiment.
Standard sampling approaches fail here because with 175 countries, random sampling produces expected coalition sizes far too large. Gumbel top-K sampling solves this by sampling exactly K countries without replacement, guaranteeing valid-sized coalitions at every step.
Sensitivity: how do reward design choices affect results?
We run a systematic sweep across different penalty structures and coalition size caps to understand which reward design produces the most useful agents.
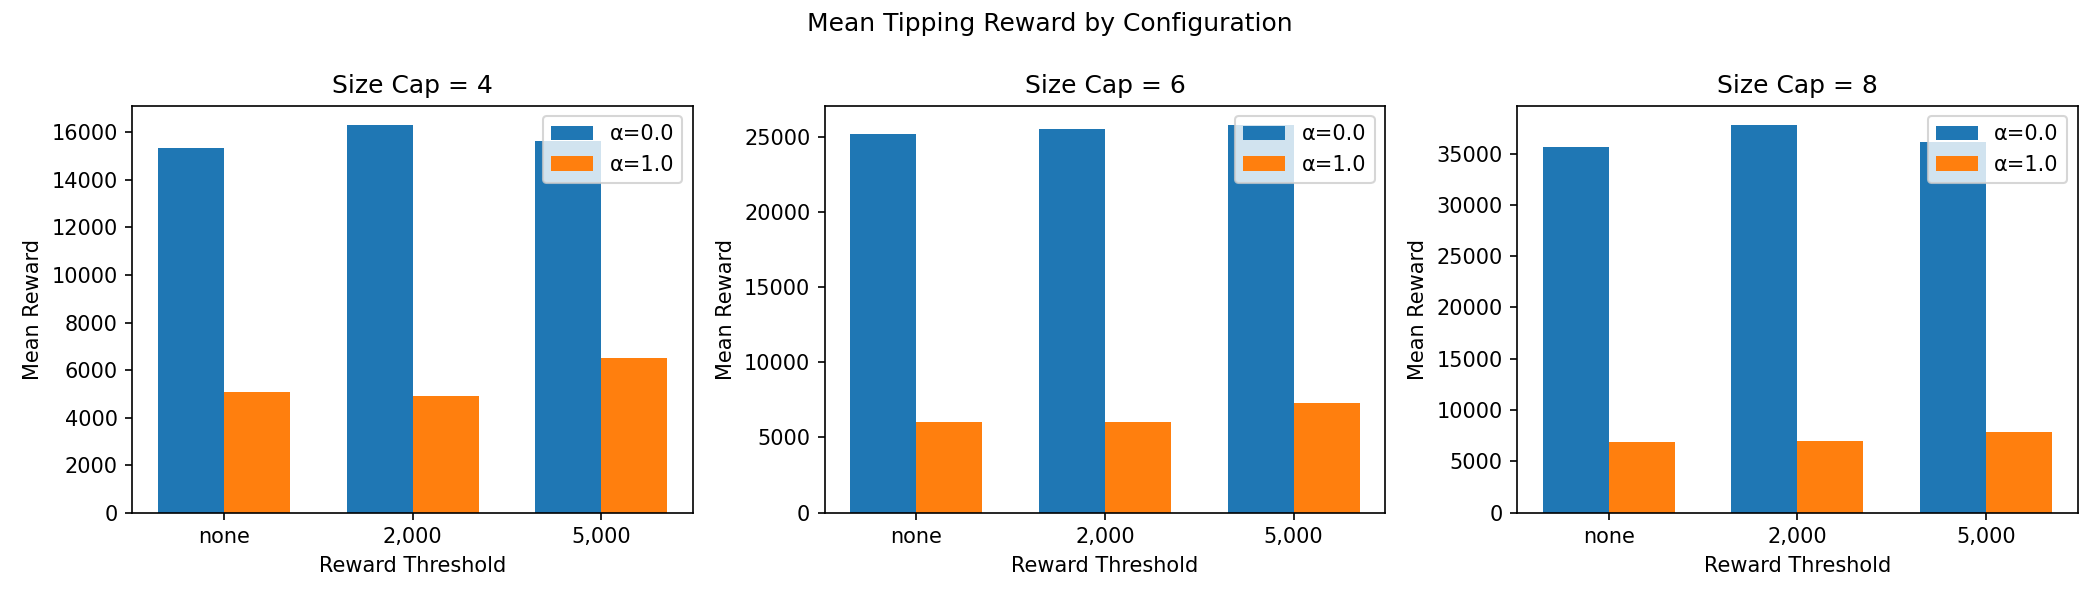
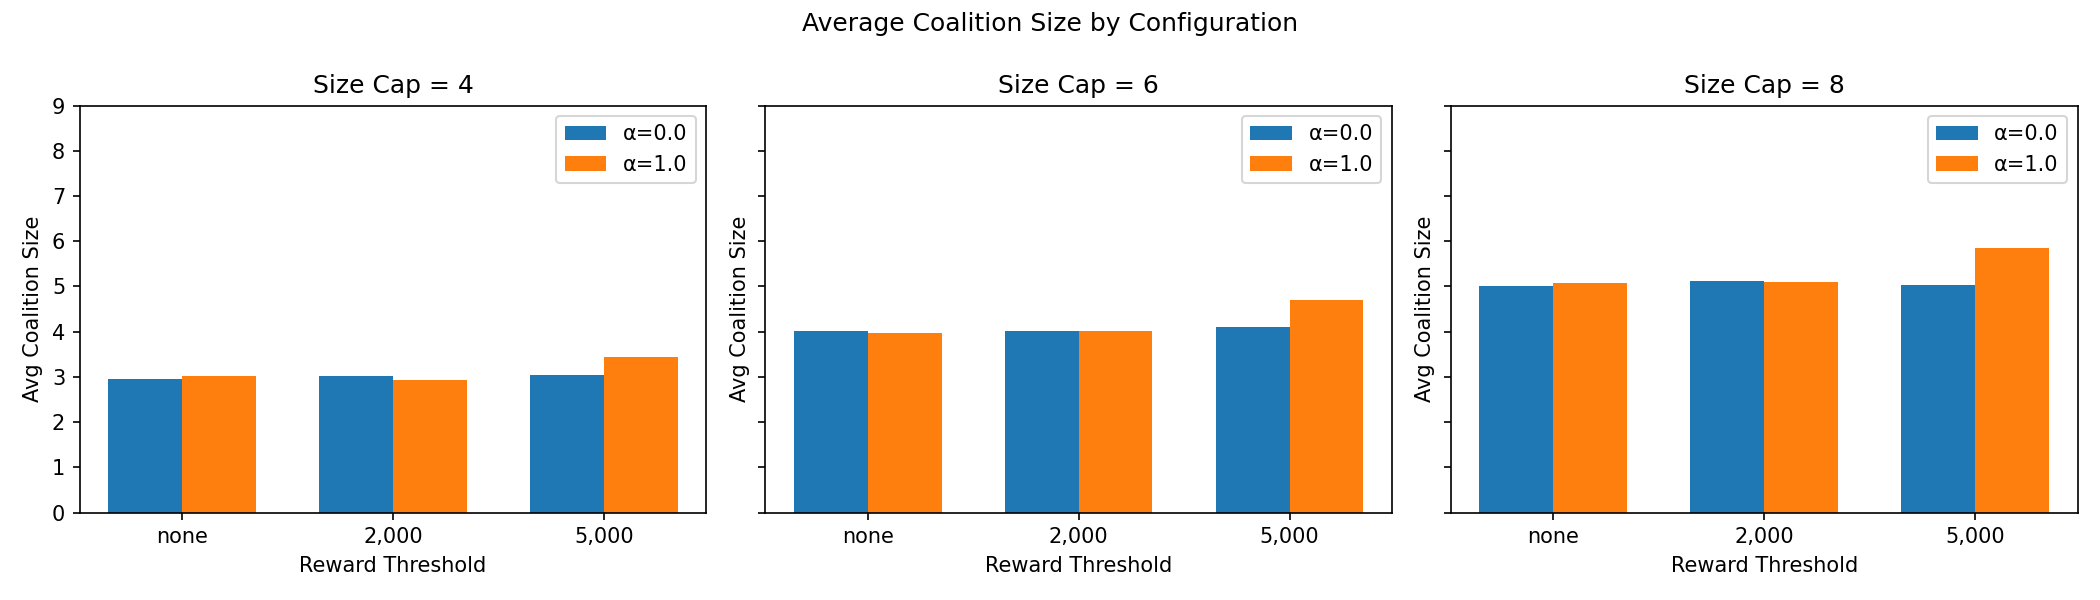
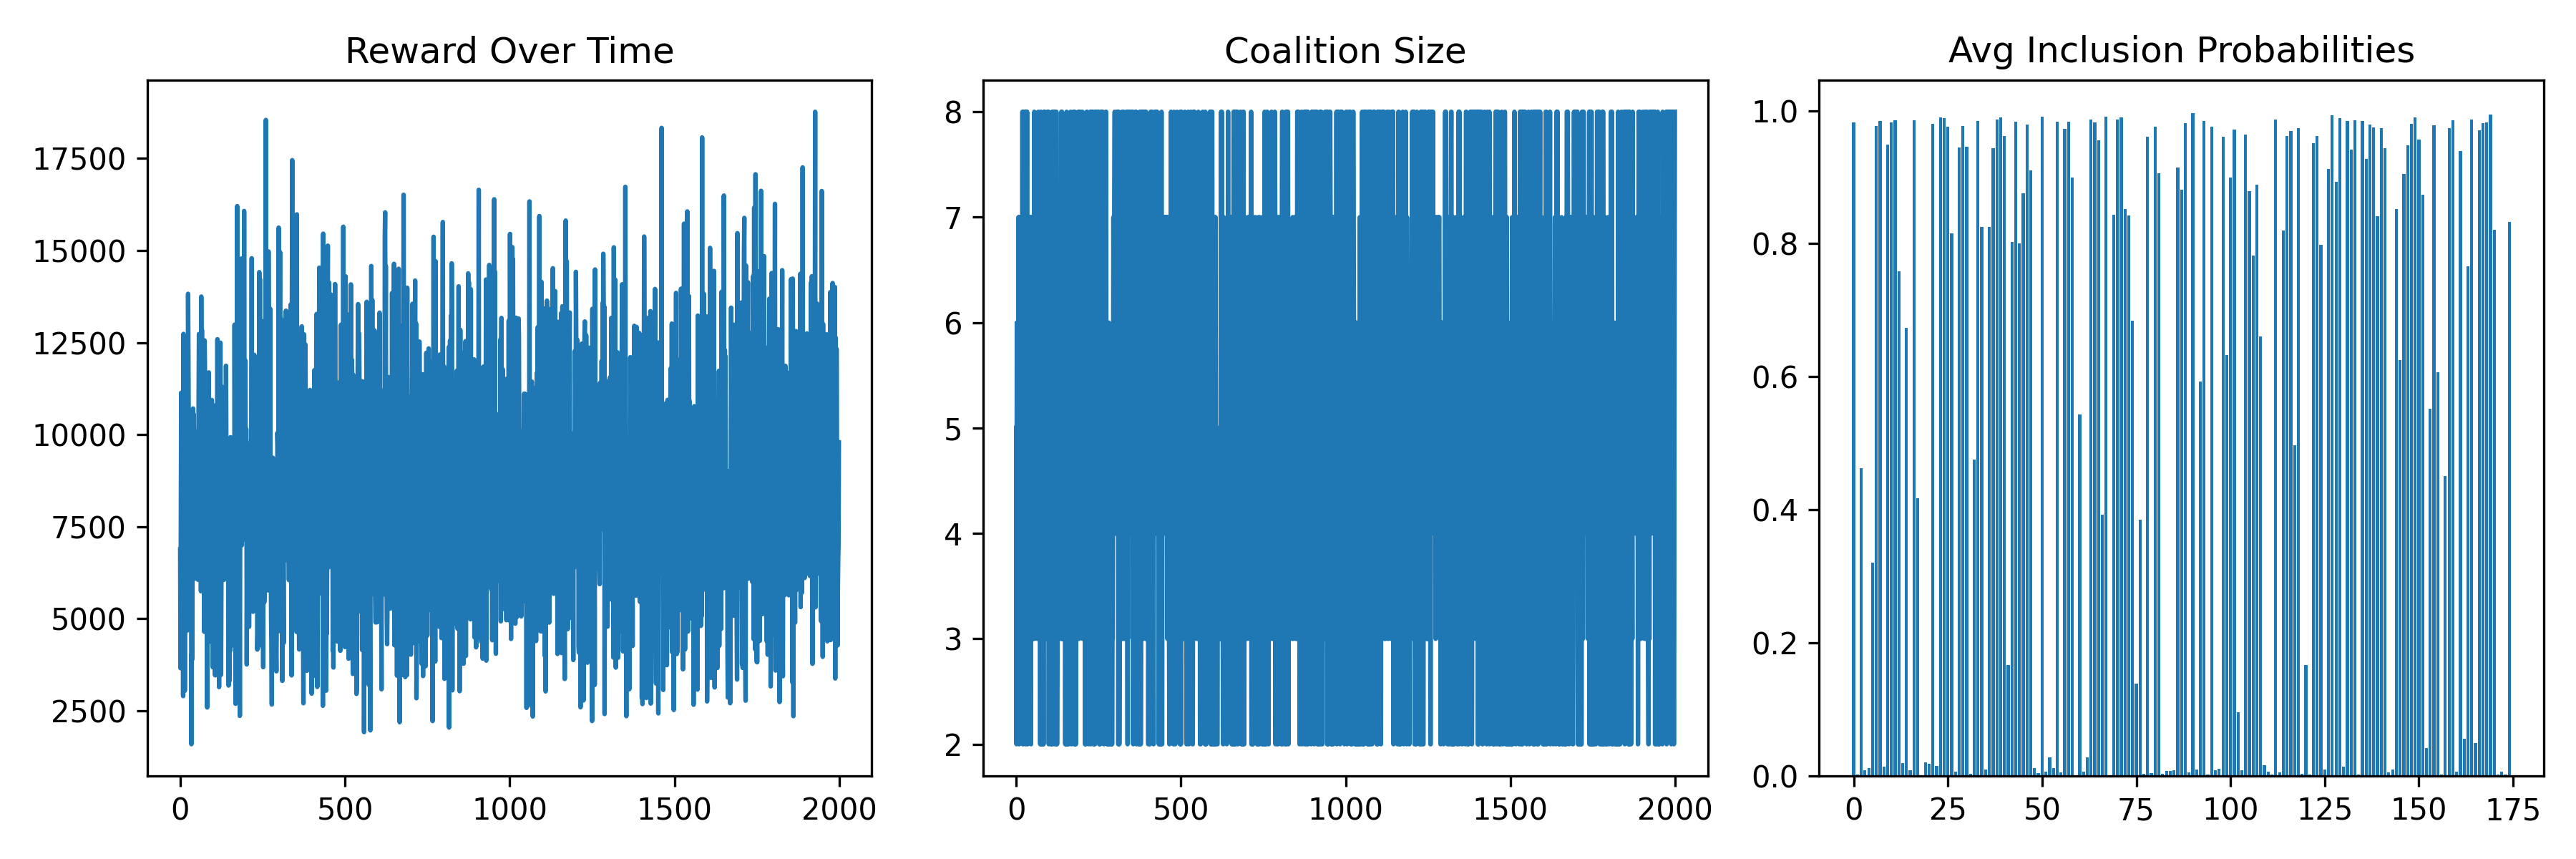
The main real-data RL training run
The final model uses α = 1 (per-member normalisation), no reward threshold, and a size cap of 8. It trains for 1,000 epochs and generates 5,000 post-training samples.
Results: what the model found
Overall performance
| Method | Best tipping score | Unique coalitions |
|---|---|---|
| Random search (10,000 samples) | 19,382 | — |
| Greedy forward selection | 105,353 | 164 |
| REINFORCE + Gumbel top-K | 22,229 (per-member normalised) | 4,964 |
In the reported run, the peak RL score of 22,229 represents a 14.7% improvement over the best score found by an equivalent random search of 10,000 samples.
These scores are not a single league table. The greedy score (105,353) and the RL score (22,229) use different normalisations and cannot be compared directly. Greedy coalitions are scored on absolute tipping potential — the total score grows with coalition size. RL coalitions are scored per member, dividing by coalition size, which penalises larger groups. Both methods outperform their respective random-search baselines, but placing both numbers in the same table can give the false impression that greedy search found a "better" result by a factor of four. It has not — they are measuring related but different things.
The top-ranked coalition
The highest-scoring RL coalition reported in this run (score = 22,229):
This coalition spans 7 of 8 treaty-participation clusters, includes two Small Island Developing States (Bahamas, Saint Kitts and Nevis), and achieves a mean composite vulnerability score of 0.504 — placing it above the dataset median and generating a 25% multiplicative bonus from the vulnerability weighting.
Countries appearing most often: candidate coalition anchors
Across the top-100 highest-scoring RL coalitions, certain countries appear disproportionately often. These are structural candidates — countries that score well on the model's criteria — not confirmed diplomatic pivots:
| Country | Top-100 frequency | Composite vulnerability |
|---|---|---|
| Uruguay | 23% | 0.40 |
| Tunisia | 20% | 0.63 |
| Greece | 16% | 0.64 |
| Algeria | 16% | 0.56 |
| Georgia | 15% | 0.30 |
| Spain | 15% | 0.58 |
| Peru | 15% | 0.56 |
| Sweden | 15% | 0.39 |
| Finland | 13% | 0.41 |
| Saint Kitts and Nevis | 12% | 0.50 |
Within this model, Uruguay and Tunisia score highly because they combine dense treaty ratification profiles (high alignment with many partners) with above-median vulnerability scores — each property independently boosts the tipping score, and together they create a persistent advantage in the scoring function. Whether this translates to real diplomatic leverage is a question the model cannot answer.
Cross-cluster diversity is the defining feature of top coalitions
In the reported top-10 set, every coalition spans at least 6 of the 8 treaty clusters. Only 0.3% of all sampled coalitions achieve 7-cluster coverage — yet every top-10 coalition does. Within-cluster coalitions (reflecting existing regional blocs) score substantially lower on average: these are the configurations already visible to diplomats. The cross-cluster alliances are the configurations that computational discovery is uniquely placed to surface.
Sanity check: overlap with known real-world climate coalitions
As a plausibility check, we test whether model-identified coalitions share members with known real-world climate groupings. All 164 unique greedy coalitions overlap with at least one of:
This is a plausibility check, not a validation. The model cannot confirm that AOSIS or the High Ambition Coalition were effective because of their tipping properties, nor that the countries it identifies would be equally effective in practice. The overlap shows only that the structural features the model rewards — cross-regional diversity, treaty alignment, climate exposure — are consistent with the composition of groups that real diplomats have independently assembled. It is a sanity check that the scoring criterion is pointing in a plausible direction, nothing more.
What this research does — and does not — show
This is a formal mathematical model grounded in treaty data. It identifies structural candidates — not diplomatic certainties. The table below sets out the boundary.
| What it does show | What it does not show |
|---|---|
| Which country configurations score highest on a structural measure of tipping potential, derived from 70 years of treaty co-ratification data | Which coalitions will be diplomatically effective — that depends on politics, trust, and context that no model captures |
| That cross-cluster, cross-regional diversity is consistently associated with high tipping scores in this dataset | That any individual country is geopolitically pivotal; individual-country conclusions require detailed diplomatic analysis beyond this framework |
| That the RL agent discovers coalitions scoring 14.7% above a random search baseline on the model's own metric | That 22,229 is a meaningful absolute threshold — it is a dimensionless score specific to this model's normalisation and dataset |
| That model-identified coalitions overlap in membership with historically significant real-world groups (AOSIS, High Ambition Coalition, FF-NPT) — a plausibility check | That these real-world groups succeeded because of their tipping properties; the overlap is correlational, not causal |
Candidate countries are not prescriptions. Uruguay, Tunisia, Greece, and Algeria emerge consistently because they combine dense treaty ratification profiles with above-median vulnerability scores — two properties the scoring function rewards. Whether these structural features translate to real diplomatic leverage is a question for political scientists and negotiators, not for this model to settle. The appropriate use of these results is as a starting point for targeted diplomatic analysis, not as a ranked list of "most important" countries.
A brief note on the mathematics
This section is for readers who want a slightly more precise description without reading the full paper.
The game
The model is an N-player simultaneous-move game Γ = (N, {[0,1]}N, {ui}). Each player i chooses a cooperation level si ∈ [0,1]. The payoff is:
u_i(s) = s_i · (∑_{j,k} T_{ijk} · s_j · s_k + θ_i) + H_b(s_i)
where Hb is the binary entropy — a bounded-rationality term that rewards keeping options open. At a Nash equilibrium, the first-order condition gives:
s_i* = σ(∑_{j,k} T_{ijk} · s_j* · s_k* + θ_i)
where σ is the logistic function. This is a quantal response equilibrium (McKelvey & Palfrey, 1995).
The key analytical result (Proposition 1)
For the real-data tensor (where Tijk = xj · xk, the dot product of treaty vectors), the first-order shift in the dominant Z-eigenvalue when a coalition C is activated is:
dλ_max/dη |_{η=1} = (1/√N) · [InternalSpread(C) + 2 · InfluenceSpread(C)]
This exact formula connects the tipping score directly to the spectral bifurcation criterion. InternalSpread and InfluenceSpread are the core components of the tipping score, confirming the scoring function has a rigorous game-theoretic foundation.
Code, data, and reproducibility
All code and processed data are publicly available. The IEA treaty dataset, ND-GAIN Country Index, and WRI Aqueduct 4.0 are available from their respective sources (linked in the repository).
| Resource | Location |
|---|---|
| Full repository | GitHub |
| Python scripts | python/ |
| Dependencies | requirements.txt |
| Figure-to-script map | REPRODUCIBILITY.md |
| Pre-computed outputs | python/outputs/ |
Key Python dependencies: numpy scipy pandas scikit-learn matplotlib
networkx torch seaborn pycountry pycountry-convert. Python 3.10+ recommended.
Note on reproducibility: deterministic scripts (clustering,
exhaustive search, greedy search) produce identical outputs from the same inputs.
RL training is seeded at 42 for demonstration; exact coalition membership may
vary across seeds, but score distributions are stable.
See REPRODUCIBILITY.md for the full figure map.